
FED CUTS, COVID-19 AND BOND YIELDS MAKE FOR A HISTORIC WEEK
The S&P 500 added 0.6% for the week. While that is technically true, the slight change masks the fact that the S&P 500 bounced around a 235-point range since last Friday.
Coronavirus-related fears remained top of mind, and the growing focus on new cases in the U.S. and abroad exerted pressure on the market’s expectations for growth. The Federal Reserve announced an emergency 50 basis point rate cut on Tuesday, but the fed funds futures market expected another imminent sharp cut the next day. Treasuries charged higher throughout the week, sending the 10-yr yield lower by 42 basis points to 0.71%.
Congress approved $8.50 bln in emergency spending measures while administration officials hinted at targeted stimulus. However, that did little to improve investor sentiment.
Countercyclical sectors like utilities (+7.9%), consumer staples (+6.2%), health care (+5.0%), and real estate (+4.8%) ended the week in positive territory with health care climbing after Joe Biden won the bulk of primaries on Super Tuesday, seizing the Democratic delegate count lead from Bernie Sanders.
Cyclical sectors bore the brunt of the pressure with energy (-7.3%) and financials (-4.1%) finishing at the bottom of the barrel. The energy sector fell as crude oil slid to its lowest level since mid-2016 in the $41.00/bbl area. Reports from midweek suggested that OPEC would agree to a significant output cut, but Friday’s OPEC meeting failed to produce an agreement.
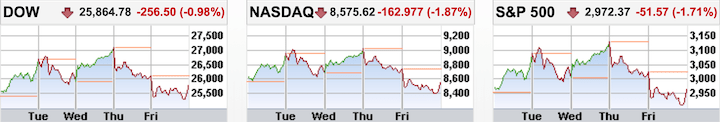
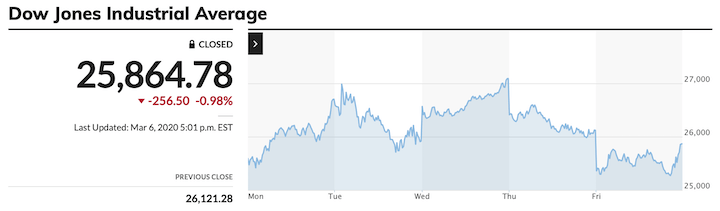
- Dow Jones Industrial Average -9.4% YTD (up for the week +4.6%)
- Nasdaq Composite -4.4% YTD (up for the week +6.1%)
- S&P 500 -9.4% YTD (up for the week +3.5%)
- Russell 2000 -13.1% YTD (down for the week -0.4%)

(Economic Excerpts from Briefing.com)
MONDAY 02 MARCH:
Final US February Manufacturing PMI 50.7 vs 50.8 February prelim; January final 51.9
ISM Manufacturing Index barely skirts contraction in February
The ISM Manufacturing Index for February managed to eke out an expansion reading at 50.1 (consensus 50.5), but that was weaker than expected and down from 50.9 in January. The dividing line between growth and contraction is 50.0.
The key takeaway from the report is that there were noted concerns in respondents’ commentary about the negative impact of the coronavirus, which is telling because the virus has continued to spread globally since the report was compiled, implying there is an increased risk of the index falling below 50.0 in March.
According to the ISM, the past relationship between the PMI and the overall economy indicates that the February reading corresponds to a 2.1% increase in real GDP on an annualized basis.
- The New Orders Index dropped to 49.8 from 52.0.
- The production Index fell to 50.3 from 54.3.
- The Employment Index edged up to 46.9 from 46.6.
- The Prices Index decreased to 45.9 from 53.3.
- The Imports Index pulled back to 42.6 from 51.3.
Construction Spending jumps solidly in January
Total construction spending increased 1.8% m/m in January (consensus +0.7%) on the heels of an upwardly revised 0.2% increase (from -0.2%) in December. Residential spending was up 2.0% m/m and nonresidential spending was up 1.6% m/m.
The key takeaway from the report is that January marked the largest m/m increase in construction spending since February 2018, bolstered by continued strength in residential spending.
- Total residential spending was up 9.2% yr/yr while total nonresidential spending was up 5.1% yr/yr.
- Total private construction spending increased 1.5% m/m in January. Residential spending jumped 2.1% while nonresidential spending increased 0.8%, paced by a 3.4% increase in power spending and a 1.4% increase in commercial spending.
- Total public construction spending increased 2.6% m/m. Highway and street spending was up 5.4% and educational spending was up 0.7%.
TUESDAY 03 MARCH:
No Data Released
WEDNESDAY 04 MARCH:
02/29 MBA Mortgage Applications Index 15.1% vs consensus of 0.4%; prior was 1.5%
Feb ADP Employment Change 183K vs consensus of 165K; prior was revised to 209K from 291K
ISM Non-Manufacturing Index accelerates in February
The ISM Non-Manufacturing Index for February registered a 57.3% reading (consensus 54.8%) versus 55.5% in January. The February reading is the highest reading for the index since February 2019.
The key takeaway from the report is that the February number is encouraging in its own right, but with the coronavirus caseload rising in the U.S. and the public’s attention to containing it increasing, doubts are festering that the strength can be sustained.
According to the ISM, the past relationship between the Non-Manufacturing PMI and the overall economy indicates the February reading corresponds to a 3.0% increase in real GDP on an annualized basis.
- The New Orders Index increased to 63.1% from 56.2%.
- The Employment Index rose to 55.6% from 53.1%.
- The Prices Index fell to 50.8% from 55.5%.
- The New Export Orders Index jumped to 55.6% from 50.1%.
- The Backlog of Orders Index advanced to 53.2% from 45.5%, its first expansion in five months.
THURSDAY 05 MARCH:
Initial claims on the low side (per usual)
Initial claims for the week ending February 29 were down 3,000 to 216,000 (consensus 215,000). Continuing claims for the week ending February 22 increased by 7,000 to 1.729 million.
The key takeaway is that the labor market still isn’t showing signs of cracking due to the coronavirus, yet that understanding will be offset by the fear that it’s going to move in that direction.
- The four-week moving average for initial claims increased by 3,250 to 213,000.
- The four-week moving average for continuing claims decreased by 7,500 to 1,721,250.
- Initial claims have held below 300,000 for 261 straight weeks.
Q4 Productivity and unit labor costs revised down
Nonfarm business sector labor productivity increased 1.2% in the fourth quarter (consensus 1.3%), according to a revised estimate, versus an originally reported 1.4% increase. Unit labor costs were revised down to 0.9% (Briefing.com consensus 1.4%) from 1.4%.
The key takeaway from the revision is that productivity was relatively weak in the fourth quarter, which is a headwind to an increased standard of living.
- The revision in productivity reflected a 0.1-percentage point downward revision to output and a 0.1-percentage point upward revision to hours. Output increased 2.4% and hours worked increased 1.2%.
- The average annual rate of nonfarm business sector productivity growth from 2007 to 2019 is 1.4%, versus the long-term rate of 2.1% for 1947 to 2019.
Factory Orders surprise on the downside in January
Factory orders declined 0.5% m/m in January (Briefing.com consensus -0.1%) following an upwardly revised 1.9% increase (from 1.8%) in December. Shipments also declined 0.5% m/m in January after increasing 0.5% in December.
The key takeaway from the report is that it didn’t alter the view that business spending was decent in January, evidenced by a 1.1% increase in new orders for nondefense capital goods excluding aircraft, which was unchanged form the Advanced Durable Goods Orders report.
- Orders for durable goods declined 0.2% m/m in January after a large 2.8% increase in December.
- Orders for nondurable goods declined 0.8% m/m in January after increasing 1.1% in December.
- The inventory-to-shipments ratio held steady at 1.40.
FRIDAY 06 MARCH:
February employment report is strong, not that anyone cares :
The February employment report was a strong report, accented by big gains in nonfarm payrolls, upward revisions to prior months, and a nice increase in average hourly earnings.
The key takeaway from the report isn’t what was in the report, it was the lackluster response to it, which is a function of expecting employment reports in coming months not to look as good because of the coronavirus impact.
- February nonfarm payrolls increased by 273,000 (consensus 170,000). Job gains have averaged 243,000 over the last three months. January nonfarm payrolls revised to 273,000 from 225,000. December nonfarm payrolls revised to 184,000 from 147,000.
- February private sector payrolls increased by 228,000 (consensus 160,000). January private sector payrolls revised to 222,000 from 206,000. December private sector payrolls revised to 164,000 from 142,000.
- February unemployment rate was 3.5% (consensus 3.6%), versus 3.6% in January. Persons unemployed for 27 weeks or more accounted for 19.2% of the unemployed versus 19.9% in January. The U6 unemployment rate, which accounts for unemployed and underemployed workers, was 7.0%, versus 6.9% in January.
- February average hourly earnings were up 0.3% (consensus +0.3%) after increasing 0.2% in January. Over the last 12 months, average hourly earnings have risen 3.0%, versus 3.1% for the 12 months ending in January
- The average workweek in February was 34.4 hours (consensus 34.3), versus 34.3 hours in January. Manufacturing workweek increased 0.2 hours to 40.7 hours. Factory overtime increased 0.1 hour to 3.2 hours.
- The labor force participation rate was unchanged at 63.4%.
January Wholesale Inventories -0.4% vs -0.2% consensus; prior was -0.3%
January Consumer Credit $12.0 bn vs consensus of $17.5 bln; prior was $20.2 bln
Trade deficit shrinks in January on back of decline in imports :
The trade deficit narrowed to $45.3 billion (consensus -$46.0 billion) in January from an upwardly revised -$48.6 billion ( from -$48.9 bln) in December.
The key takeaway from the report is that it featured a decline in both exports and imports; however, the understanding that this is a January report (i.e. doesn’t capture the brunt of the coronavirus impact) will diminish market interest in it.
- Exports were $0.9 billion less than December exports. Imports were $4.2 billion less than December imports.
- Exports of capital goods fell by $1.0 billion, largely on account of a $1.7 billion decrease in civilian aircraft.
- Imports of industrial supplies and materials decreased by $2.4 billion with nonmonetary gold imports (-$1.3 billion) accounting for more than half of that decline.
- The real trade deficit narrowed to $77.7 billion from $80.0 billion in December and was 1.1% below the fourth quarter average.

Tuesday 03 March 2020
Federal Reserve trying to play doctor with rate cut
The Federal Reserve announced a “surprise” 50 basis points cut in the target range for the federal funds rate to 1.00% to 1.25%, citing the evolving risks to economic activity posed by the coronavirus. The vote by the Federal Open Market Committee was unanimous.
This announcement came right on the heels of a G7 conference call this morning, which concluded with a communique that said all appropriate tools would be used to support growth and guard against downside risk, but which lacked any specific measures.
The G7 itself isn’t a policy-setting entity, but it is a collection of seven members who can act unilaterally — together — to present a coordinated front.
The assumption, based on the Fed doing what it did, is that other major central banks will soon follow suit with accommodative policy announcements of their own.
Nevertheless, the move to cut rates now begs the question as to whether it will make any true difference in combatting the economic fallout from the spreading coronavirus.
Does this surprise rate cut now convince someone to book a trip to northern Italy? Not likely. More to the point, did this surprise rate cut eradicate the coronavirus? Absolutely not.
The Federal Reserve can get some credit for attempting to act pre-emptively to mitigate the adverse economic effects of the coronavirus, but is it really a confidence booster that the Fed is stepping in with an intra-meeting cut of 50 basis points after Fed officials only a few weeks ago were talking about being patient and wanting to see how the data unfolded to assess the impact of the coronavirus?
Maybe the ugly manufacturing and non-manufacturing PMI numbers out of China over the weekend were all it needed to see. Maybe the escalating caseload in the U.S. was enough writing on the wall that future economic activity here is going to suffer as consumers and businesses shut themselves in to guard against contracting the virus.
Fed Chair Powell will be holding a press conference at 11:00 a.m. ET to discuss today’s decision, so more will be learned then.
What has been learned thus far is that the market once again bullied the Fed into cutting rates. Remember, the fed funds futures market went from showing no chance of a 50 basis points cut at the March meeting only a week ago to a 100% probability as of yesterday.
That’s partially why today’s “surprise” rate cut isn’t a complete surprise. It was in the market; hence, the initial response to the “surprise” move has been underwhelming in the grand scheme of things.
An underwhelming response, though, is arguably the right response. The Federal Reserve is aiming to provide a fix for a health issue it can’t cure.
Release
• • • • •
Fed releases Beige Book : Report
• • • • •
Stimulus Fever
In terms of stimulus, Tuesday (2/3) and Wednesday (3/3) have produced:
- A 25 basis points rate cut by the Reserve Bank of Australia to 0.50%
- A 25 basis points rate cut by the Malaysian central bank to 2.50%
- A 50 basis points emergency rate cut by the FOMC to a target range of 1.00% to 1.25%
- A 50 basis points cut by the Hong Kong Monetary Authority to 1.50%
- A 50 basis points cut by the Bank of Canada to 1.25%
- A $12 billion aid program provided by the World Bank
- A $50 billion aid program from the IMF for low-income and emerging market countries
- Congressional approval of ~$8 billion of emergency aid for dealing with COVID-19

COVID-19 UPDATE
Monday 02 March 2020
IMF lays out possible toolkit options to help countries respond to the coronavirus
- Emergency financing
- Augment existing lending programs
- Grants for debt relief
- New financing arrangement
IMF release
• • • • •
Tuesday 03 March 2020
World Bank Group announces up to $12 billion immediate support for COVID-19 country response
As COVID-19 reaches more than 60 countries, the World Bank Group is making available an initial package of up to $12 billion in immediate support to assist countries coping with the health and economic impacts of the global outbreak. This financing is designed to help member countries take effective action to respond to and, where possible, lessen the tragic impacts posed by the COVID-19 (coronavirus). The COVID-19 support package will make available initial crisis resources of up to $12 billion in financing — $8 billion of which is new — on a fast track basis. This comprises up to $2.7 billion new financing from IBRD; $1.3 billion from IDA, complemented by reprioritization of $2 billion of the Bank’s existing portfolio; and $6 billion from IFC, including $2 billion from existing trade facilities. It will also include policy advice and technical assistance drawing on global expertise and country-level knowledge.
The World Bank Group is actively engaged with international institutions and country authorities to help coordinate the global response.
World Bank release
• • • • •
Friday 06 March 2020
Coronavirus Cases Exceed 100,000
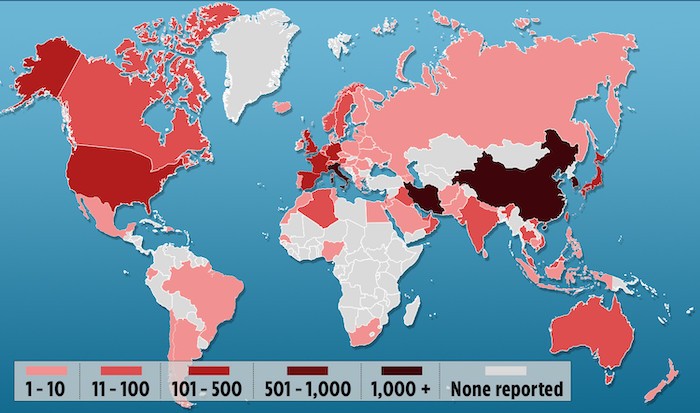
Twenty-one people aboard a cruise ship that was barred from docking in San Francisco have tested positive for coronavirus, U.S. officials said on Friday, adding to the more than 100,000 cases of the fast-spreading illness across the world.
The outbreak has killed more than 3,400 people and spread across more than 90 nations, with seven countries reporting their first cases on Friday. The economic damage has also intensified, with business districts starting to empty and stock markets continuing to tumble.
Full Reuters Report

Asia-Pacific
China’s February Manufacturing PMI 35.7 (expected 46.0; last 50.0) and Non-Manufacturing PMI 29.6 (last 54.1). February Caixin Manufacturing PMI 40.3 (expected 45.7; last 51.1). February Caixin Services PMI 26.5 (last 51.8).
Hong Kong’s February Manufacturing PMI 33.1 (last 46.8).
- Hong Kong Monetary Authority lowered its base rate by 50 bps to 1.50%
Japan’s February Manufacturing PMI 47.8 (expected 47.6; last 47.6). February Household Confidence 38.4 (last 39.1). February Services PMI 46.8 (expected 46.7; last 51.0). January Household Spending -1.6% m/m (expected 0.9%; last -1.7%); -3.9% yr/yr (expected -4.0%; last -4.8%). January Average Cash Earnings 1.5% yr/yr (expected 1.3%; last -0.2%) and January Overall wage income of employees 1.5% yr/yr (last -0.2%). January Leading Index -0.7% m/m (last 0.8%).
- Japan’s plan to quarantine visitors from China and South Korea was met with pushback from Seoul and an accusation that Japan’s main interest is to avoid a cancellation of Olympic games in the summer.
South Korea’s February trade surplus $4.12 bln (last $4.12 bln). February Imports 1.4% yr/yr (expected -6.9%; last 1.4%) and Exports 4.5% yr/yr (expected 3.4%; last 4.5%). Q4 GDP 1.3% qtr/qtr (expected 1.2%; last 0.4%); 2.3% yr/yr (expected 2.2%; last 2.0%). February CPI 0.0% m/m (expected -0.1%; last 0.6%); 1.1% yr/yr (expected 1.0%; last 1.5%).
Australia’s February AIG Manufacturing Index 44.3 (last 45.4). Q4 Business Inventories 0.3% m/m (expected -0.1%; last -0.2%). January Building Approvals -15.3% m/m (expected 1.0%; last 3.9%). Q4 GDP 0.5% qtr/qtr (expected 0.3%; last 0.6%); 2.2% yr/yr (expected 1.9%; last 1.7%). February AIG Construction Index 42.7 (last 41.3) and February Services PMI 49.0 (expected 48.4; last 50.6). January trade surplus AUD5.21 bln (expected surplus of AUD4.80 bln; last surplus of AUD5.38 bln). January Imports -3% m/m (last 2%) and Exports -3% m/m (last 1%). January Retail Sales -0.3% m/m (last -0.7%). February AIG Services Index 47.0 (last 46.6).
- Australia’s Treasury Secretary said that Q1 GDP will be reduced by 50 basis points due to the impact of the coronavirus while bushfires will have reduced Q4 GDP by 20 basis points.
New Zealand’s Q4 Terms of Trade Index 2.6% qtr/qtr (expected 0.7%; last 1.9%). January Building Consents -2.0% m/m (expected -0.9%; last 9.8%).
India’s February Nikkei Markit Manufacturing PMI 54.5 (expected 52.8; last 55.3) Hong Kong’s January Retail Sales -21.4% yr/yr (last -19.4%). February Nikkei Services PMI 57.5 (expected 52.9; last 55.5).
Singapore’s January Retail Sales -5.3% yr/yr (last -3.4%); 0.1% m/m (last -0.4%)
Europe
Eurozone Final February Manufacturing PMI 49.2 (expected 49.1; last 49.1). Preliminary February CPI 0.2% m/m (expected -1.0%; last -1.0%) and 1.2% yr/yr (expected 1.2%; last 1.4%); core CPI 0.4% m/m (expected -1.7%; last 0.1%) and 1.2% yr/yr (expected 1.1%; last 1.1%). Preliminary February PPI 0.4% m/m (expected 0.5%; last 0.1%) and -0.5% yr/yr (expected -0.5%; last -0.6%). January unemployment rate 7.4% 9expected 7.4%; last 7.4%). February Services PMI 52.6 (expected 52.8; last 52.5) and Composite PMI 51.6 (expected 51.6;last 51.3); January Retail Sales 0.6% m/m (expected 0.6%; last -1.1%) and 1.7% yr/yr (expected 1.1%; last 1.7%).
Switzerland’s Q4 GDP 0.3% qtr/qtr (expected 0.2%; last 0.4%) and 1.5% yr/yr (expected 1.3%; last 1.1%). February CPI 0.1% m/m (expected 0.2%; last -0.2%) and -0.1% yr/yr (expected 0.1%; last 0.2%).
UK Final February Manufacturing PMI 51.7 (expected 51.8; last 51.9). February Construction PMI 52.6 (expected 48.8; last 48.4). February Services PMI 53.2 (expected 53.3; last 53.9) and Composite PMI 53.0 (expected 53.3; last 53.3). February New Car Sales -2.9% yr/yr (last -7.3%). February Halifax House Price Index +0.3% m/m (expected +0.2%; last +0.4%) and +2.8% yr/yr (last +4.1%).
Germany’s February Final Manufacturing PMI 48.0 (expected 47.8; last 47.8). February Services PMI 52.5 (expected 53.3; last 54.2) and Composite PMI 50.7 (expected 51.1; last 51.2); January Retail Sales 0.9% m/m (expected 1.0%; last -2.0%) and 1.8% yr/yr (expected 1.5%; last 1.7%). February Construction PMI 55.8 (last 54.9). January Factory Orders +5.5% m/m (expected +1.4%; last -2.1%).
France’s February final Manufacturing PMI 49.8 (expected 49.7; last 49.7). February Services PMI 52.5 (expected 52.6; last 51.1) and Composite PMI 52.0 (expected 51.9; last 51.1). January Trade Balance EUR -5.88 bln (last EUR -3.72 bln).
Italy’s Manufacturing PMI 48.7 (expected 49.2; last 48.9). January unemployment rate 9.8% (expected 9.8%; last 9.8%). February Services PMI 52.1 (expected 51.4; last 51.4) and Composite PMI 50.7 (last 50.4); Q4 GDP -0.3% qtr/qtr (expected -0.3%; last 0.1%) and 0.1% yr/yr (expected 0.3%; last 0.3%). January Retail Sales 0.0% m/m (last +0.5%) and +1.4% yr/yr (last +0.8%).
Spain’s February Manufacturing PMI 50.4 (expected 49.2; last 48.5). Unemployment change -7,800 (expected 90,200). February Services PMI 52.1 (expected 52.5; last 52.3). February Consumer Confidence 85.7 (last 87.2). January Industrial Production -2.1% yr/yr (expected -1.3%; last +1.1%).

Friday 06 March 2020
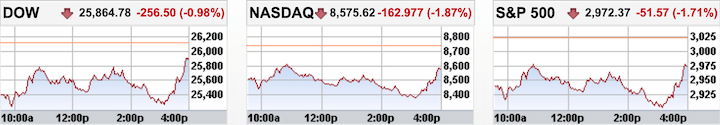
Market Remains on Edge as Growth Concerns Build
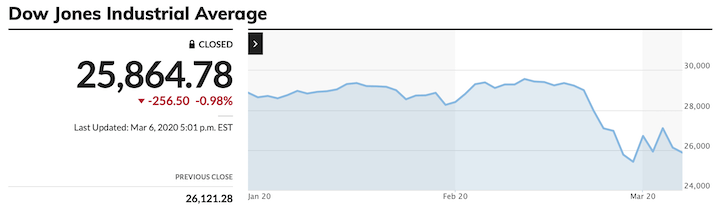
The stock market ended a volatile week on a lower note with the S&P 500 (-1.7%) settling just above its low from Monday. The benchmark index gained 0.6% for the week while the Dow Jones Industrial Average (-1.0%) outperformed, gaining 1.8% since last Friday.
The final session of the week was marred by a continued deterioration of sentiment due to the ongoing spread of the coronavirus while the pressure on growth expectations intensified. Treasuries essentially never stopped after Thursday’s cash close, continuing their forceful charge in the overnight futures market. Treasuries did pull back from their highs in midday trade, but the long bond rallied to a fresh record high in the afternoon while the 10-yr note stopped a bit short of its best level of the day. The 10-yr yield fell 22 basis points to 0.71%, representing a 42-basis point drop for the week.
Expectations for another sharp rate cut remain in place with the fed funds futures market pointing to a 56.0% implied likelihood of a 75-basis point rate cut at or before the conclusion of the FOMC meeting on March 18.
The S&P 500 staged a 70-point rally during the final hour of trade, which led to a significant improvement in final sector standings, though all eleven sectors finished in the red.
Four groups surrendered 2.0% or more. Energy (-5.6%) and financials (-3.3%) were particularly weak throughout the day due to their exposure to growth and concerns about issuers of high-yield debt in the energy sector.
Bank stocks suffered from the drop in Treasury yields while energy companies struggled as oil fell $4.57, or 10.0%, to $41.32/bbl. The energy component ended the day at its lowest level since mid-2016 after OPEC+ could not agree to a sharp production cut despite yesterday’s reports to the contrary. Russia’s Energy Minister, Alexander Novak, said that OPEC+ countries are free to pump at will starting from April 1.
Airline stocks like Alaska Air (ALK), JetBlue Airways (JBLU), United Airlines (UAL), and Delta Air Lines (DAL) recorded gains on Friday after recovering from fresh multi-year lows. Alaska Air did warn that its guidance for FY20 should no longer be relied upon due to coronavirus-related uncertainty.
Shares of cruise operators started the day in positive territory but retreated as the day went on. NorwegianCruise Line Holdings (NCLH) was the weakest performer of the bunch, stopping just above its record low (24.16) that was notched when the company went public in early 2013.
In company-specific news, Costco (COST) reported better than expected Q2 results, but the stock still finished lower. AMD (AMD) fared better than the broader market after reaffirming its guidance for FY20. The chipmaker did caution that Q1 results are likely to be on the low end of its guidance.
The CBOE Volatility Index (VIX 42.14) hit an 11-year high at 54.39%, before pulling back as the market jumped off lows in late trade.
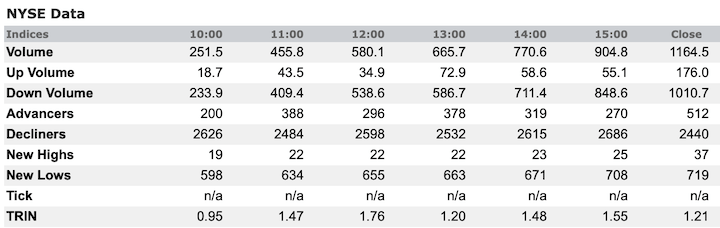
Market Internals – Friday 06 March 2020


Dollar:
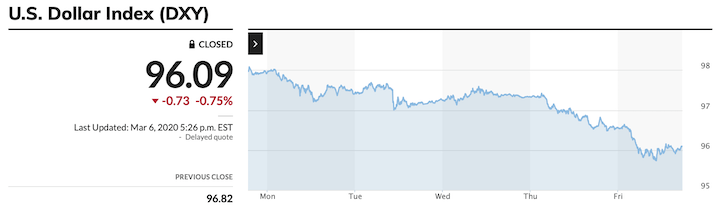
The U.S. Dollar Index fell 2.2% to 96.09 from 98.13 the previous week as rate-cut expectations boiled over. According to the CME FedWatch Tool, there is a 100% probability of another 50 basis points cut at the March 17-18 FOMC meeting and a 63% probability of a 75 basis points cut.
Other currency pairs;- EUR/USD: 1.1317 from 1.1026 the previous week
- GBP/USD: 1.2993 from 1.2789
- USD/CNH: 6.9260 from 6.9841
- USD/JPY: 106.90 from 107.79
Bonds:
U.S. 10-year yields drop below 1% for first time ever
Tuesday 3 March (Reuters) – U.S. benchmark 10-year Treasury yields on Tuesday slid below 1% for the first time, after the Federal Reserve slashed interest rates by half a percentage point in an emergency move to ease the economic fallout from the fast-spreading coronavirus. U.S. yields were down across the board after the Fed action, as investors grabbed safe-haven Treasuries amid the uncertainty.
Full NASDAQ Article
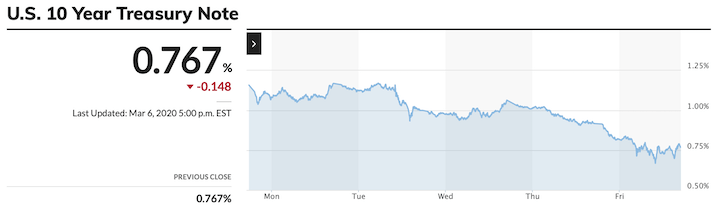
U.S. Treasuries had another huge day on Friday as the stock market racked up another day of huge losses amid ongoing concerns about the spread of the coronavirus and budding credit worries. The 10-yr yield, which settled Thursday at 0.93%, went as low as 0.66% in Friday’s curve-flattening trade before losing some steam. The February employment report was stronger than expected, but was glossed over as market participants envisioned weaker data in the months ahead due to the coronavirus impact.
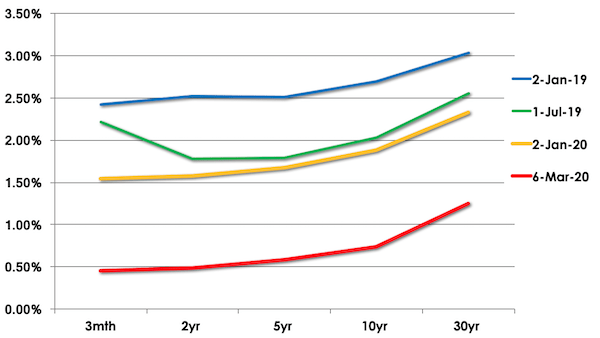
- 2-yr: down -39 bps to 0.49% from 0.88% from the previous week
- 5-yr: down -35 bps to 0.56% from 0.91%
- 10-yr: down -39 bps at 0.71% from 1.10%
- 30-yr: down -43 bps at 1.22% from 1.65%
The yield curve fell by double figures and flattened again this week with the 10-year yield falling under 1% for the first time.
- The spread on the 2s5s increased to +7bp from the previous week at +3bps.
- The spread between the 5s10s decreased to +15bps from +19bps the previous week.
- The spread on the 10s30s decreased to +51bps from +55bps the week before.
The Inversion between the 10-year yield and the Fed Funds Rate is now three weeks old having inverted after Valentine’s Day 2020. This is its second inversion in a year. Last year’s inversion between May and October 2019 signalled the possibility of an oncoming economic recession sometime from end-Q2 to Q3 2020.
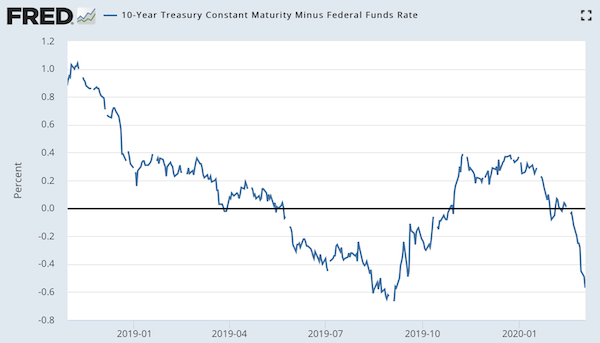
The current inversion, if sustained, could be signalling an extended period of the aforementioned recession into Q4 2021.

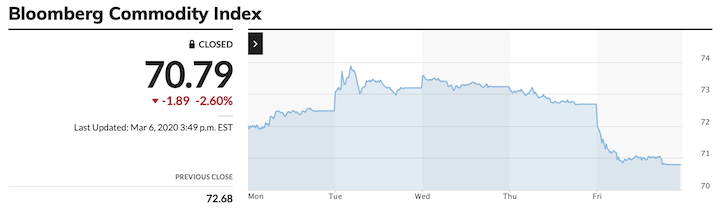
The Bloomberg Commodity Index fell to 70.70, lower than 70.98 previous week as Crude and Grains fell.
Energy:
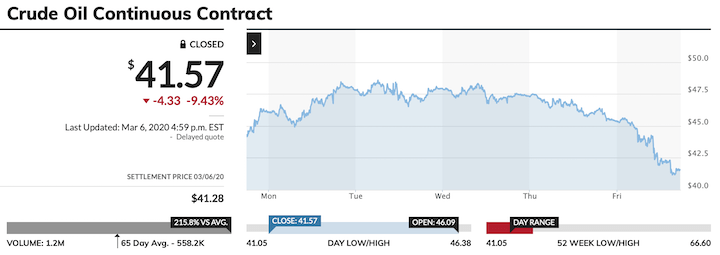
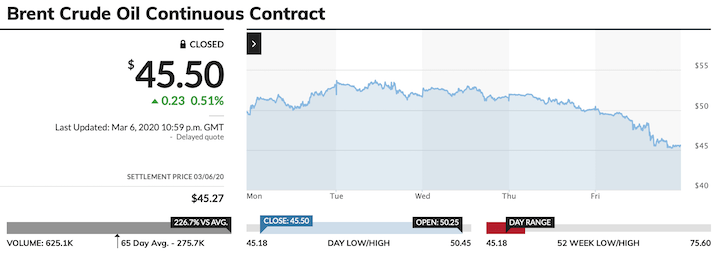
WTI oil settled the week at $41.28/barrel, down from $44.76/barrel the previous week while Brent settled at $45.27/barrel, down from $49.67/barrel the previous week. The spread between WTI and Brent tightened to 3.99 from $4.91 the previous week.
EIA petroleum data for the week ended February 28:
- Crude Oil Inventories had a build of 0.785 mln
- Prior week showed a build of 0.452 mln
- Gasoline inventories had a draw of 4.34 mln barrels
- Prior week showed a draw of 2.691 mln barrels
U.S. crude oil imports averaged 6.2 million barrels per day last week, up by 21,000 barrels per day from the previous week. Over the past four weeks, crude oil imports averaged about 6.5 million barrels per day, 2.5% less than the same four-week period last year. Total motor gasoline imports (including both finished gasoline and gasoline blending components) last week averaged 511,000 barrels per day, and distillate fuel imports averaged 125,000 barrels per day.
U.S. commercial crude oil inventories (excluding those in the Strategic Petroleum Reserve) increased by 800 thousand barrels from the previous week. At 444.1 million barrels, U.S. crude oil inventories are about 4% below the five year average for this time of year. Total motor gasoline inventories decreased by 4.3 million barrels last week and are about 2% above the five year average for this time of year. Finished gasoline and blending components inventories both decreased last week. Distillate fuel inventories decreased by 4.0 million barrels last week and are about 7% below the five year average for this time of year. Propane/propylene inventories decreased by 3.6 million barrels last week and are about 37% above the five year average for this time of year. Total commercial petroleum inventories decreased last week by 11.9 million barrels last week.
Natural gas inventory showeda draw of 109 bcf vs a 143 bcf draw last week. Working gas in storage was 2,091 Bcf as of Friday, February 28, 2020, according to EIA estimates. This represents a net decrease of 109 Bcf from the previous week. Stocks were 680 Bcf higher than last year at this time and 176 Bcf above the five-year average of 1,915 Bcf. At 2,091 Bcf, total working gas is within the five-year historical range.
Baker Hughes total U.S. rig count increased +3 at 793 following last week’s decrease to 790.
- Mar Crude Oil futures: $41.28/barrel from $44.76/barrel from the previous week
- Mar Brent Crude Oil Futures: $45.27/barrel from $49.69/barrel
- Mar Natural Gas: $1.73/MMBtu from $1.70/MMBtu
Metals:
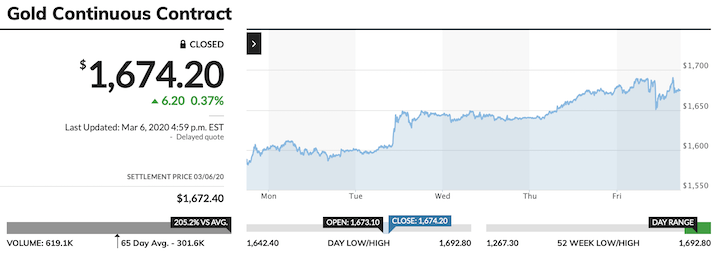
- Mar Gold: $1672.40/oz from $1,566.70/oz the previous week
- Mar Silver: $17.35/oz from $16.68/oz
- Mar Copper: $2.55/lb from $2.54/lb
Agriculture:
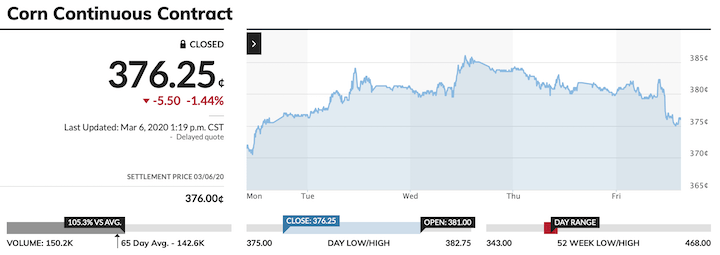
- Mar Corn: $3.76/bushel from $3.68/bushel the previous week
- Mar Wheat: $5.14/bushel from $5.25/bushel
- Mar Soybeans: $8.89/bushel from $8.93/bushel

MONDAY 03 MARCH 2020
Consumer Staples (XLP)
The Consumer Staples sector was a powerhouse sector on Monday 03 March, rising +5.53% in a single session as the market saw some relief from the previous weeks’ sell-down, which might seem a bit odd in a stock market that appears to have a risk-on mindset. The S&P 500 finished the Monday session up 4.6% in the market’s biggest points gain session in history, yet the basis for the strength in the consumer staples sector runs counter to a risk-on mindset. (Staples = Defensive)
In brief, the outperformance of the consumer staples sector is rooted in a halo effect of sorts surrounding Costco (COST +9.96% on Monday).
Costco was up big on Monday on anecdotal reports that it has been a big beneficiary of consumers stockpiling food and other staples as a precautionary measure in the face of the coronavirus scare, thinking either that there will be shortages of such items or that an eventual large-scale outbreak in the U.S. will keep them at home.
This thinking has understandably carried over favorably to Walmart (WMT +7.62%) and Kroger (KR +5.51%) as well, which are leading grocers that stock the products made by consumer staples companies, most of which gained between 6% to 9% on Monday.
Notable Monday Movers:
- Clorox (CLX +7.90%): With rising demand for cleaning agents to help guard against contamination, Clorox has been a hot stock, up nearly 8.0% month-to-date, .
- Kimberly Clark (KMB +7.5%): Provider of diapers, baby wipes, toilet paper, paper towels, and sanitizers, among many other products
- Colgate Palmolive (CL +7.21%): Operates in oral, personal and home care, and pet nutrition segments
- Campbell Soup (CPB +6.34%): Provider of convenience foods, including soup, that generally have long(er) shelf life
- Procter & Gamble (PG +5.59%): Maker of laundry detergents, diapers, toilet paper, and health care products, among many other products

WEEK 11 (09 to 13 March 2020)
- The second week of March is usually bullish with some divergence
- The fourth day of the week tends to be very bullish
- The week tends to end in volatile fashion with Friday 13th being rather bearish
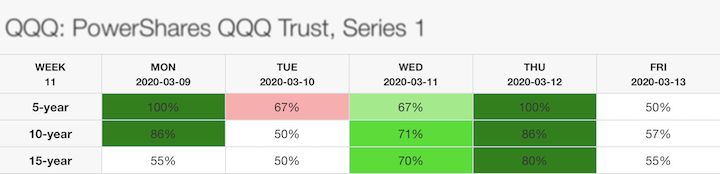
According to our 5, 10 and 15 year seasonal models for the Benchmark ETFs:
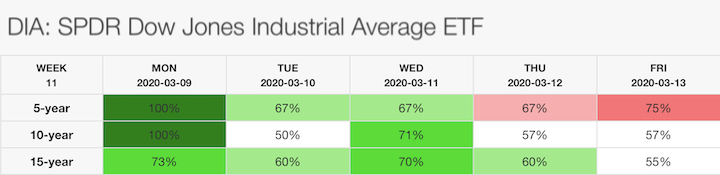
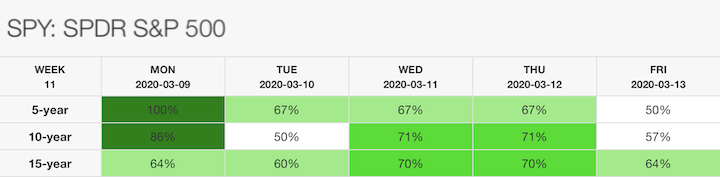
Benchmarks Indices (21 year average) for Week 11:
- DOW is usually bearish on Monday and bullish from Tuesday till Friday.
- S&P is expected to be bullish from Monday and Thursday and very bearish on Friday.
- NASDAQ is normally bullish on Monday, bearish on Tuesday, bullish again on Wednesday and Thursday before ending the week bearish on Friday.

Week 11 Key Economic Events
Next week, focus will again remain on cornovarius developments. As the virus hit transport, travel and tourism sectors all over the world, investors will be waiting for more stimulus measures from central banks and governments. The ECB holds monetary policy meeting on Thursday and UK will publish Spring Budget for 2020 on Wendesday. In the US, main releases include inflation and consumer confidence data. Other important events to be followed are UK monthly GDP, Eurozone and Japan final Q4 GDP figures; Germany industrial output; China consumer and producer inflation; Australia business and consumer morale; and India inflation and industrial production.
The US consumer price inflation is seen slowing to 2.3 percent in February from 2.5 percent the month before, which was the highest since October 2018. In addition, the preliminary reading of Michigan consumer sentiment is expected to point to a sharp deterioration in consumer morale during March as the spread of coronavirus in the country accelerated, which triggered an unscheduled Fed interest rate cut this week. Other notable publications are producer and foreign trade prices and the government’s budget statement.
Meanwhile, all eyes turn to Britain’s first post-Brexit budget on Wednesday as finance minister Rishi Sunak announces the tax and spending plans of the new government in parliament. PM Boris Johnson’s election pledges included a cut in social security contributions and £100 billion more public investment by the mid-2020s, but uncertainty surrounding the coronavirus outbreak and the outcome of Brexit trade talks could lead to a reallocation of funds towards other priorities. On the economic data front, key releases are monthly GDP figures, manufacturing production, construction output and foreign trade.
Elsewhere in Europe, the ECB is likely to slash its deposit rate by 10bps to support the bloc’s economy in the fight against coronavirus. In terms of data, the Eurozone will be releasing the final estimate of fourth-quarter GDP figures, while Germany, France and Italy are set to publish industrial output data for January, with market forecasts pointing to rebounds in activity following steep falls in December. Traders will also keep an eye on Germany foreign trade, Switzerland and Turkey jobless rates, and Sweden and Ireland inflation rates.
In China, data to be published include consumer and producer prices, with forecasts pointing to a slowdown in inflation from January’s eight-year high while producer prices should fall back into deflationary territory amid the coronavirus outbreak. Meanwhile, Japan‘s final reading of fourth-quarter should show a steeper contraction than previously estimated. The country’s current account and Eco Watchers Survey will also be in the spotlight. Australia will be publishing NAB business confidence, Westpac consumer confidence and home loans; while traders in India will follow consumer inflation and industrial output.
Other key data for the Asia-Pacific region include: Taiwan trade balance; South Koreaunemployment rate; Philippines foreign trade, Singapore unemployment and retail sales; Malaysia industrial production and unemployment rate; and New Zealand business NZ PMI.
Investors will also react to the IEA’s Oil Market Report and OPEC’s Monthly Report. Crude prices tumbled to the lowest level since 2016 after OPEC removed all limits on its own production in response to Russia’s refusal to agree on deeper oil cuts.
Week 11 Key Economic Dates
Monday 09 March- China – Trade balance, USD Denominated Trade Balance
- Australia – NAB Business Confidence
- China – CPI y/y, New Loans
- Australia – RBA Deputy Gov Debelle Speaks
- UK – GDP m/m, Manufacturing Production m/m, Annual Budget Release
- US – Crude Oil Inventories
- US – PPI and Core PPI m/m, Initial Claims, Natural Gas Storage
- EU – Main Refinancing Rate, Monetary Policy Statement, ECB Press Conference
- US – Consumer Sentiment

“Expect a bounce in the early part of the week but don’t get too caught up in it. The week is likely to resume its bearish tendencies as it gets hit with a fresh dose of economic data that will likely be downside or revised to the downside in light of the increasing threat of COVID-19 worldwide. WHO refuses to call it a pandemic so let’s just call it a worldwide epidemic that’s killing more and more people everyday. Nevertheless, it can only get worse before it gets better at this stage.“
Both the S&P500 and DJIA closed out the week below their respective 200DSMA with the DJIA displaying a higher low while the S&P looks like completing a Double Bottom.
While it is natural to be skeptical that the market could bounce in the coming week, I won’t be discounting the possibility of a relief rally or short squeeze as the Seasonal Models are suggesting. The market is at the stage where it will look for any small reason to rally even to the extent of accepting bad news as “not as bad as expected”.
I’ll be watching for signs that the sell-down has stalled but won’t be jumping in bullishly with both feet at the first sign of a relief rally. Dead Cats have a habit of Bouncing anyway.
Happy Hunting!Copyright© 2020 FinancialScents Pte Ltd
~~~~~~~~~~~~~~~~~~~~~~~~~~~~~~~~~~~~
• • • • •

After 14 years of educating, mentoring and supporting hundreds of participants (annually) in the arts and sciences of Finance and Economics, the Pattern Trader™ Tutorial has evolved to become the most exclusive and sought-after boutique-styled class that caters to retail individuals, institutional professionals, businesses and families that are serious about their finances and their prospects as we move into the future.

The small class environment and tutorial-styled approach gives the Tutorial a conducive environment that allows for close communication and interaction between the mentor and the participants.
The hands-on style makes the Tutorial very practical for anyone who requires a start from the ground up. It is the perfect beginning for anyone who wishes to take that first step in improving their financial and economic literacy.
• • • • •
If you’re looking to make a huge difference in your financial life and get the most value for your education investment, there’s no better choice than the time-tested and well reputed Pattern Trader™ Tutorial.
• • • • •
Download our promo slides here:
The Pattern Trader™ Tutorial 2020

~~~~~~~~~~~~~~~~~~~~~~~~~~~~~~~~
Write to conrad@finscents.com for queries and further information