
MONDAY 25 TO 29 SEPTEMBER 2023
(Excerpts from Briefing.com, tradingeconomics.com, marketwatch.com, CNBC )
Market Still Lacking Clarity
The stock market settled the week mixed at the index level. Some rebound attempts throughout the week left the Nasdaq and Russell 2000 with slim gains while the Dow Jones Industrial Average and S&P 500 declined 1.3% and 0.7%, respectively. This is a growing belief that the stock market is due for a bounce after suffering steep losses in September, but rising long-term rates kept stocks in check.
The 10-yr note yield jumped 15 basis points this week, and 50 basis points this month, to 4.59%. The 2-yr note yield declined seven basis points this week, and rose 16 basis points this month, to 5.03%.
The concern for stock market participants is not necessarily the size of the rate increases, but rather the pace at which rates are moving. In addition, the jump in rates more recently doesn’t appear to be tied to a fear of more rate hikes by the Fed.
The fed funds futures market sees only a 14.2% probability of a 25-basis points rate hike at the November FOMC meeting, versus 27.5% a week ago and 62.3% a month ago, according to the CME FedWatch Tool.
That understanding may create some angst about what else is driving the Treasury market. Some other factors include: the Fed having a long way to go still with its QT efforts, other central banks possibly selling Treasuries in a bid to support their currencies, and concerns about the budget deficit issue.
In addition to the move in interest rates, seasonality was cited as another potential factor weighing over the market. September, historically, has been the worst month of the year for the S&P 500.
Market participants received some economic data this week, including a weaker than expected August new home sales report, a low level of weekly jobless claims, and some pleasing inflation data in the form of the core-PCE Price Index for August.
WTI crude oil futures jumped more than $7.00/bbl this month, settling Friday’s session at $90.78/bbl, which stoked lingering concerns about inflation expectations, rising gas prices, and a slowdown in consumer spending.
The rate-sensitive S&P 500 utilities sector saw the largest decline this week by a decent margin, falling 7.0%. The next worst performer was the consumer staples sector (-2.1%). Only the energy (+1.3%) and materials (+0.2%) sectors registered gains on the week.
Below are truncated summaries of daily action:
Monday:
The major indices registered modest gains on Monday, but the complexion of things beneath the index surface showed an otherwise mixed market on a day when long-term rates continued to rise. The major indices nonetheless closed near their highs for the session.
The 10-yr note yield jumped ten basis points to 4.54%, which is its highest level in nearly 16 years. Equities took that move in stride, though, after an initial bout of selling.
Stocks moved somewhat lower at the open, pressured by the jump in rates and carryover downside momentum after last week’s losses. Things turned around quickly, though, and the major indices bounced off their lows, helped by a reversal in the mega cap stocks. The index bounce also coincided with the S&P 500 slipping below an initial support level at 4,305, which attracted some overdue buying interest amid a sense that stocks were short term oversold.
There was no U.S. economic data of note on Monday.
Tuesday:
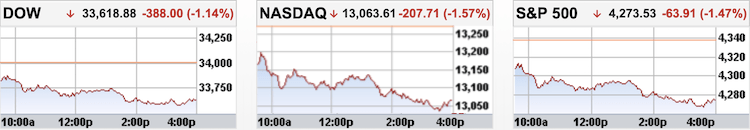
The major indices all fell more than 1.0% on Tuesday, erasing Monday’s modest rebound right out of the gate. The negative bias was due in part to ongoing worries about higher interest rates.
Concerns about higher rates were stoked by JPMorgan Chase CEO, Jamie Dimon, who told the Times of India that he is not sure the world is prepared for 7%, and Minneapolis Fed President Kashkari (FOMC voter), who said, according to Bloomberg, that he thinks another rate hike before year end would likely be needed if the economy is stronger than expected.
Seasonality was cited as another potential factor contributing to the negative price action. September, historically, has been the worst month of the year for the S&P 500.
Mega caps and semiconductor stocks paced broad based losses, but it was the rate-sensitive utilities sector (-3.1%) that saw the biggest decline.
Amazon (AMZN) was an individual standout of note to the downside following news that the FTC and 17 state attorneys general are suing the company for illegally maintaining monopoly power.
Reviewing Tuesday’s economic data:
- July FHFA Housing Price Index 0.8%; Prior was revised to 0.4% from 0.3%
- July S&P Case-Shiller Home Price Index 0.1% (consensus 0.5%); Prior -1.2%
- September Consumer Confidence 103.0 (consensus 105.0); Prior was revised to 108.7 from 106.1
- The key takeaway from the report is that the drop in consumer confidence was driven by consumers’ weakening expectations for future business conditions, job availability, and incomes, all of which has the potential to translate into softer spending activity.
- August New Home Sales 675K (consensus 695K); Prior was revised to 739K from 714K
- The key takeaway from the report is that new home sales acti
Wednesday:
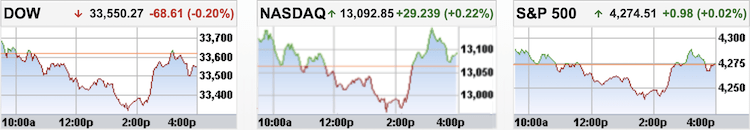
Stocks were seemingly poised for a rebound in the early going following sharp losses on Tuesday and this month. Equities started to fade, however, as oil prices and market rates moved higher. The major indices ultimately settled off their lows thanks to a mega-cap powered climb in the afternoon trade.
Notably, the afternoon improvement happened despite yields and crude oil futures remaining elevated.
Despite the mixed index level performance, breadth was positive this session. Advancers had a roughly 11-to-10 lead over decliners at the NYSE and the Nasdaq.
Mega caps, semiconductor stocks, and growth stocks outperformed and helped support the broader market.
Reviewing Wednesday’s economic data:
- The weekly MBA Mortgage Applications Index declined 1.3% with purchase applications falling 1% and refinance applications dropping 2%.
- Total durable goods orders increased 0.2% month-over-month in August (consensus -0.2%) following a downwardly revised 5.6% decline (from -5.2%) in July. Excluding transportation, durable goods orders were up 0.4% (consensus 0.3%) following a downwardly revised 0.1% increase (from 0.5%) in July.
- The key takeaway from the report is that orders for non-defense capital goods excluding aircraft – a proxy for business spending – were up a robust 0.9% month-over-month, rebounding from a 0.4% decline in July.
Thursday:

The stock market experienced some choppiness in the early going, but quickly found some upside momentum following Wednesday’s afternoon bounce. The positive bias stemmed from a belief that the stock market is due for a bounce after suffering steep losses in September. The major indices all registered gains, but closed off their highs of the day. The S&P 500 finished just a whisker shy of 4,300.
True to September form, the price action in the Treasury market was a big directional driver for stocks.
Even when market rates hit their highs of the session, stocks were holding up fairly well. Presumably, that was viewed as a positive development that invited additional rebound interest.
Some mega caps had been trading down in the early going, limiting index performance. Apple (AAPL) and Microsoft (MSFT) were among the influential laggards, down 1.7% and 1.1%, respectively, at their lows of the day. They would rebound as would other mega cap stocks.
Reviewing Thursday’s economic data:
- Initial claims for the week ending September 23 increased just 2,000 to 204,000 (consensus 215,000). Continuing jobless claims for the week ending September 16 increased by 12,000 to 1.670 million.
- The key takeaway from the report is that the low level of initial claims – a leading indicator – continues to fit the framework of a tight labor market.
- The third estimate for Q2 GDP was unchanged from the second estimate at 2.1%, as expected. The GDP Deflator, though, saw a friendly downward revision to 1.7% (consensus 2.0%) from 2.0%. Benchmark revisions showed real GDP increased at an annual rate of 5.6% from the second quarter of 2020 through the first quarter of 2023, 0.2 percentage point lower than previously indicated.
- The key takeaway from the report was the improved deflator reading. The 1.7% increase was the lowest since the second quarter of 2020.
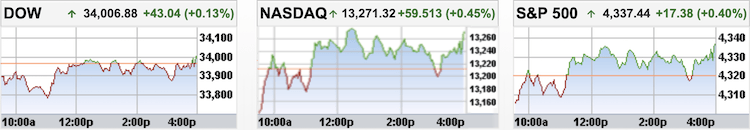
Friday:
Stocks were showing some strength in the early going, building on the rebound that started Wednesday afternoon. The S&P 500, Nasdaq, and Dow Jones Industrial Average were up 0.8%, 1.4%%, and 0.7%, respectively, at their highs of the morning. The major indices rolled over, though, and closed near their worst levels of the session.
The Nasdaq eked out a small gain, thanks to relative strength in the mega caps, while the other major indices closed in the red. Market breadth was also mixed.
A drop in market rates was a positive development and helped drive the initial upside moves. Yields climbed off their lows of the day, though, which coincided with stocks deteriorating.
Friday morning’s pleasing economic data acted as another tailwind for stocks in the early going.
In other news, the UAW called on an additional 7,000 workers at Ford (F) and General Motors (GM) to strike at noon ET, but it did not organize additional strikes at Stellantis (STLA).
Reviewing Friday’s economic data:
- Personal Income increased 0.4% month-over-month in August (consensus 0.5%) after increasing 0.2% in July. Personal spending was up 0.4% month-over-month (consensus 0.5%) after increasing an upwardly revised 0.9% (from 0.8%) in July. The PCE Price Index was up 0.4% (consensus 0.4%) while the core PCE Price Index rose 0.1% (consensus 0.4%).
- On a year-over-year basis, the headline PCE Price Index was up 3.5% versus an upwardly revised 3.4% in July (from 3.3%). However, the core PCE Price Index decelerated to 3.9% yr/yr from an upwardly revised 4.3% (from 4.2%) in July.
- The key takeaway from the report is that core price growth was a bit cooler than expected, though the overall report wasn’t weak enough to cause a sudden shift in the market’s fed funds rate range expectations.
- The Adv. Trade in Goods deficit narrowed to $84.3 billion from $90.9 billion (from -$92.2 billion) in August. Wholesale inventories declined 0.1% in August from a revised 0.2% decline (from -0.1%). Retail inventories jumped 1.1% in August from a revised 0.5% increase (from 0.3%).
- Chicago PMI fell to 44.1 in September (consensus 48.3) from 48.7 in August.
- The final reading of the University of Michigan Consumer Sentiment Index for September came in at 68.1 (consensus 67.7) versus the preliminary reading of 67.7. The final reading for August was 69.5 and one year ago in September, the reading was at 58.6.
- The key takeaway from the report is that inflation expectations were revised up from their preliminary readings for the month, but they reflected some moderation in expectations when compared to final readings for August.
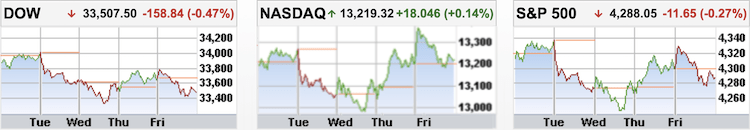
![]()
- Dow Jones Industrial Average: -1.3% for the week / +1.1% YTD
- S&P 500: +0.7% for the week / +11.7% YTD
- Nasdaq Composite: +0.1% for the week / +26.3% YTD
- Russell 2000: +0.5% for the week / +1.4% YTD

Friday 29 September 2023 AMC
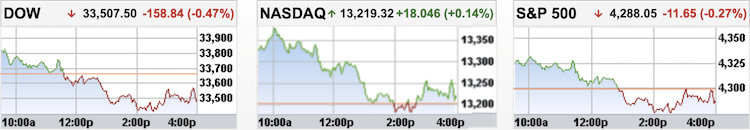
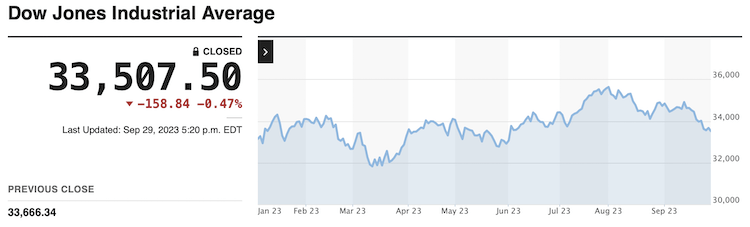
Stocks in the US finished mixed on the last trading day of the September quarter, as the prospect of a government shutdown and interest rates remaining elevated at decades high weighed on sentiments. The Dow Jones ended 157 points lower, as Walmart (-1.6%) and Chevron (-1.1%) were the biggest laggards in spite of Nike’s surge 6.7% after an upbeat earnings report. The S&P lost 0.3% while the Nasdaq added 0.1%, booking their worst month of the year.
The Dow booked a 3.2% decline this month and a 2.4% fall for the quarter. The S&P 500 finished the month down 4.8% and the quarter lower by 3.5%. The Nasdaq lost 4.9% in September, and fell 2.9% for the quarter.
- DOW closed lower at 33508 (-0.47%)
- NASDAQ closed higher at 13219 (+0.14%)
- S&P 500 closed lower at 4288 (-0.27%)
- Higher than average volume
- NYSE 1,091 mln vs avg. of 907 mln
- NASDAQ 5,178 mln vs avg. of 4,868 mln
- Advancing/declining volume
- NYSE 469 mln/608 mln
- NASDAQ 3,120 mln/2,042 mln
- Advancers led decliners on Nasdaq but not NYSE
- NYSE 1,294/1,581
- NASDAQ 2,206/2,101
- Higher than average volume
Treasuries Narrow September Losses
U.S. Treasury finished September on a higher note, extending yesterday’s rise off fresh 2023 lows in longer tenors. The trading day started with solid gains across the curve after a busy night of economic data releases from major economies. Japan reported better than expected Retail Sales (actual 7.0%; expected 6.6%) and Industrial Production (actual 0.0%; expected -0.8%) for August while Germany’s Retail Sales decreased a larger than expected 1.2% (consensus -0.7%) in August. Also of note, France reported cooler than expected CPI for September (actual -0.5%; expected -0.3%) while the eurozone’s headline CPI reading decelerated to 4.3% yr/yr from 5.2% in August and the core reading slowed to 4.5% from 5.3%.
Treasuries added to their early gains after the Personal Income (actual 0.4%; consensus 0.5%) and Personal Spending (actual 0.4%; consensus 0.5%) report for August missed expectations, showing some moderation in the yr/yr core PCE rate to 3.9% from 4.3% in July. However, the market found resistance once the 5-yr yield briefly returned to last week’s settlement. Treasuries began inching away from their highs about an hour after the start, lifting yields above their opening levels, where they remained into the close. The day went by without any reported progress in Washington, suggesting that the government is on track to enter a partial shutdown on Sunday. This week’s underperformance in longer tenors narrowed the inverted 2s10s spread by 16 bps to -44 bps. For the month, the 2s10s inverted spread narrowed by 53 bps.
- Bond Yields after the close on Friday 29 September:
- 3-mth: -1 bp to 5.55% (-1 bps for the week)
- 2-yr: -1 bp to 5.03% (-7 bps for the week)
- 5-yr: -2 bps at 4.60% (+3 bps for the week)
- 10-yr: unchanged at 4.59% (+15 bps for the week)
- 30-yr: +2 bps to 4.73% (+20 bps for the week)
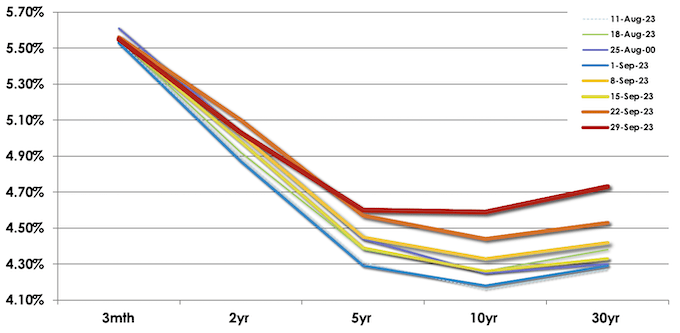
The yield curve has been flattening itself out as yields have risen to their highest levels in over a year. The inverted spread between the 5-year and 10-year maturity yields is now only -1 basis point compared to -14 basis points at the end of August.
10-YEAR/2-YEAR
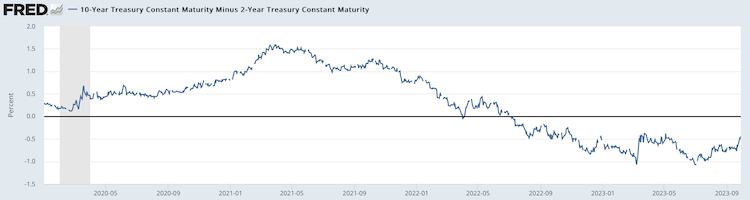
The inverted 2-year/10-year yield spread narrowed to -44 bps from -45 bps the previous session on Thursday 28 September 2023.
For the week, the inverted 2-year/10-year yield spread narrowed to -44 bps from -66 bps the previous week on Friday 22 September 2023.
- The current inversion of the 2/10 which began on Tuesday 5 July 2022 is now three-hundred and thirteen sessions old, making it the longest period of inversion in 42 years.
- The current inverted 2y/10y spread at -107 bps, printed on Wednesday 08 March 2023, surpassed the previous widest spread printed on Tuesday 07 March 2023 at -103 bps.
- One needs to go back all the way to October 1981 to see a steeper inversion than the current one.
10-YEAR/3-MONTH
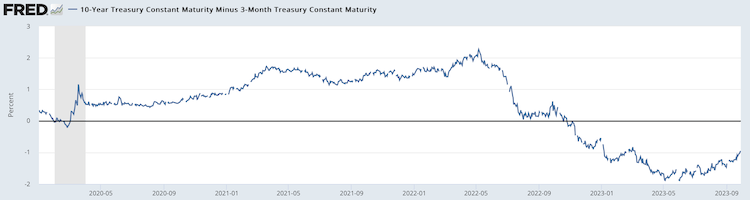
The inverted 3-month/10-year yield spread narrowed to -96 bps from -97 bps the previous session on Thursday 28 September 2023.
The inverted 3-month/10-year yield spread narrowed to -96 bps from -112 bps the previous week.
- The inverted 3m/10y spread that began on 25 October, is now two hundred and thirty-four sessions old, making it the longest inversion in 42 years.
- –189 bps printed on Thursday 01 June and Thursday 04 May is the widest inverted spread on the 3m/10y, surpassing the -188 bps printed on Wednesday 01 June and Wednesday 03 May 2023, making it the steepest inversion in 42 years.
- -189 bps surpasses all the previous inverted 3m/10y spreads over the past 50+ years.
10-YEAR/FED FUNDS RATE
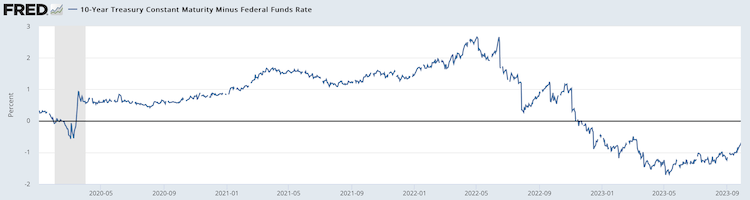
The inverted 10-year/Federal Funds Rate spread widened to -74 bps on Thursday 28 September from -72 bps on Wednesday 27 September.
The inverted 10-year/Federal Funds Rate spread narrowed to -74 bps on Thursday 28 September from -89 bps the previous Friday 22 September, 2023.
- The current 10y/FFR inversion which began on Tuesday 15 November 2022 is two hundred and eighteen sessions old.
- The -171 bps spread on Thursday 04 May 2023 surpasses the -153 bps spread printed on Wednesday 05 and Thursday 06 April 2023 as the widest of the current inversion in over 22 years.
- The current inversion has surpassed the previous two inversions;
- May 2019 to March 2020
- July 2006 to January 2008
- One needs to go back to 02 January 2001 for a deeper inversion when the 10-year/FFR was at -175 bps.
- By my estimation, the inverted 10y/FFR spread would have unchanged at -74 bps on Friday 29 September 2023.
![]()
DXY Eases Further, Heads for 2nd Win Week
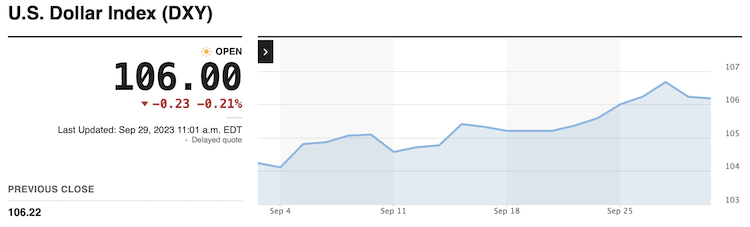
The U.S. Dollar Index eased to close at 106 on Friday, after data showed that the core PCE price index and the headline PCE prices rose by less than expected in August. The DXY is still set to advance for the second straight month, underpinned by growing optimism that the US economy could withstand higher interest rates better than other economies. Data on Thursday showed that the US economy maintained a fairly solid pace of growth at 2.1% in the second quarter, while initial jobless claims rose less than expected to 204,000 last week, adding to signs of a strong labor market. Last week, the US Federal Reserve kept interest rates unchanged but signaled another rate hike before the end of the year and fewer rate cuts than previously indicated for next year. Subsequent comments from several Fed officials have also reinforced the notion that the central bank will need to hike rates further.
Currencies Majors:
- EUR/USD: Lower by -0.8% to 1.0573 from 1.0644 the previous week, +7.9% YoY
- GBP/USD: Lower by -0.3% to 1.2197 from 1.2239 the previous week, +9.3% YoY
- USD/JPY: Higher by +0.7% to 149.33 from 148.36 the previous week, +3.2% YoY
- USD/CNY: Lower by -0.1% to 7.2937 from 7.2957 the previous week, +2.1% YoY
- USD/SGD: Higher by +0.1% to 1.3657 from 1.3637 the previous week, -4.8% YoY
Euro Holds Above $1.06 after CPI Report
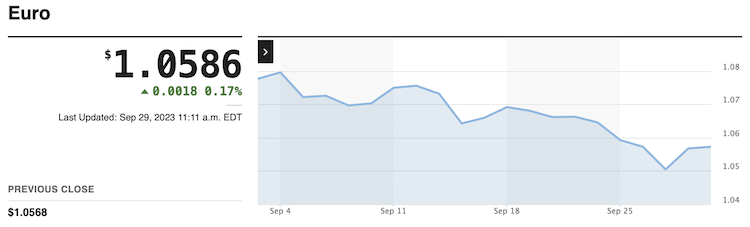
The Euro had been trading above $1.06 before settling the week lower as investors closely analysed inflation trends in the Eurozone and their potential impact on monetary policy. The region’s core inflation rate fell to 4.5% in September, the lowest level in a year and coming in below market expectations, which had anticipated a figure of 4.8%. However, the picture is far from uniform across Eurozone countries, with Spain and Italy witnessing an acceleration in inflation, while Germany reported a slowdown to levels not seen since the onset of the conflict in Ukraine. The prevailing sentiment now leans towards the belief that the European Central Bank is unlikely to pursue further interest rate hikes in the remainder of the year. Nevertheless, it’s worth noting that interest rates are still expected to remain elevated for an extended period.
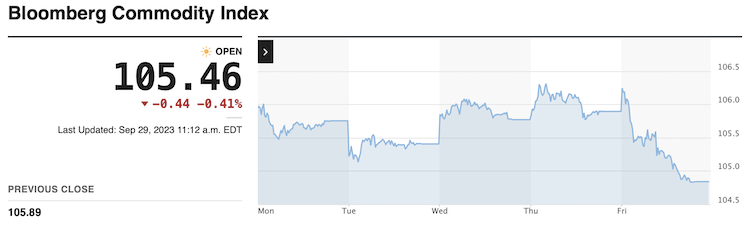
The broad-based Bloomberg Commodity Index closed lower at 105.46, down -0.7% from 106.22 in Week 38, 2023. Year-to-date, the index is down -7.1%.
Wednesday 31 May 2023’s close at 97.96 is the lowest close since Thursday 25 May 2023’s close at 99.29, setting a new 52 week low close. It is also the lowest close since 31 December 2021 at 99.17.
Wednesday 31 May 2023 saw the index print a 52-week intraday low at 97.69 at 10.00am ET, surpassing the previous 52-week intraday low on Thursday 25 May at 98.79.
The index touched an intraday high of 138.16 on Wednesday 08 June 2022 and printed its highest close this year on Thursday 09 June 2022 at 136.61, +1.20% higher than its previous high close on 18 April 2022 at 134.99.
Oil Books Monthly and Quarterly Gains
WTI crude futures traded to a high of $93.10 per barrel on Friday, closing higher for both the month and quarter, driven by tightening global supplies despite demand concerns. September saw a 12% increase in the US oil benchmark, and the third quarter recorded a 29% surge. Oil rallied as OPEC+ major players Saudi Arabia and Russia extended a combined supply cut of 1.3 million barrels per day through year-end, heightening fears of a broader market deficit in Q4. Russia’s fuel export restrictions further supported higher prices, along with declining US crude inventories. Investors are now eyeing the October 4 OPEC meeting for further production policy insights, while keeping an eye on global economic uncertainties and a hawkish US monetary policy outlook.
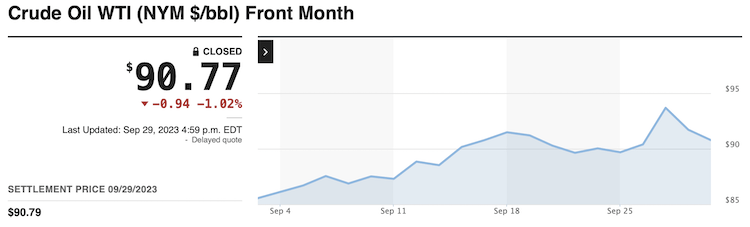
WTI crude futures settled Friday’s session off its highs at $90.79 per barrel while Brent futures came off its high of the day at $94.13 per barrel to settle at $92.20 per barrel.
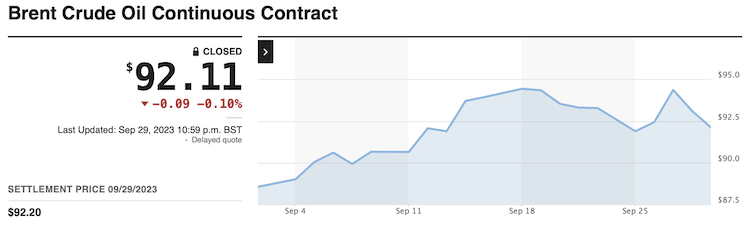
The settlement price spread between WTI and Brent decreased by -$0.52 to $1.41 from $1.93 the previous week on Friday 22 September 2023.
Baker Hughes total total U.S. rig count -7 at 623 (Prior: -11).
- WTI settled higher at $90.79/barrel from $90.33 the previous week (+12.7% YTD)
- Brent settled higher at $92.20/barrel from $91.96 the previous week (+7.1% YTD)
- Nat Gas settled higher at $2.93/MMBtu from $2.88 the previous week (-28.2% YTD)
![]()
Gold Inches Higher After PCE Inflation Data
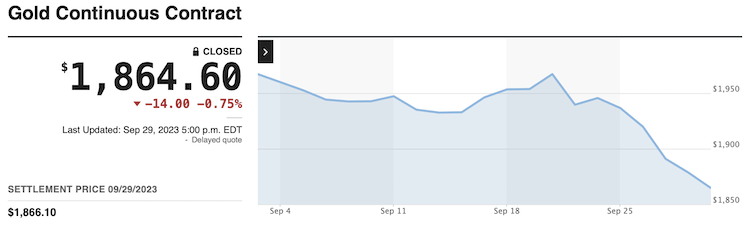
Gold settled the month lower at $1,866.10 per ounce on Friday after the US PCE report added to signs of easing inflationary pressures. The core PCE price index, the Federal Reserve’s preferred gauge to measure inflation, rose by 3.9% in August, the lowest since September 2021 and in line with market expectations, while the headline rate edged up to 3.5%, as expected. Additionally, personal income and outlays rose at solid rates, with both readings in line with consensus. Nevertheless, gold remained close to its lowest level since March, weighed down by a strong dollar and surging Treasury yields, due to expectations that the US Federal Reserve will keep monetary policy restrictive for an extended period.
- Gold settled lower at $1,866.10/oz, from $1,945.60/oz the previous week (+1.9% YTD)
- Silver settled lower at $22.45/oz, from $23.84/oz the previous week (-7.4% YTD)
- Copper settled higher at $3.74/oz, from $3.70/lb the previous week (-2.3% YTD)
![]()
Wheat Futures Hit 3-Year Low
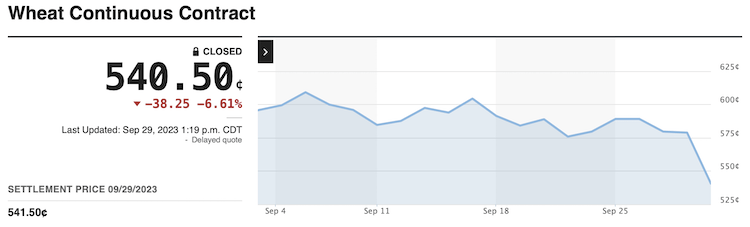
Wheat futures in the US tumbled to below $5.5 per bushel, the lowest in three years after data showed the US wheat harvest was bigger than previously estimated despite drought in key production areas of the US Plains. All-wheat production for the 2023/24 marketing year was pegged at 1.812 billion bushels, above market expectations of 1.729 billion bushels, according to the US Agriculture Department’s Small Grains Summary report. That compares with USDA’s previous forecast for 1.734 billion bushels and the 2022/23 total of 1.650 billion bushels. Meanwhile, all wheat stocks stood at 1.78 billion bushels as of September 1, up slightly from a year ago and compared with market expectations of 1.772 billion bushels, the US Agriculture Department said in its quarterly stocks report. At the same time, fuel shortages hampered economic activity in Russia’s southern breadbasket, driving Moscow to suspend exports of selected fuels to salvage sales of its bumper crop.
- Corn settled lower at $4.77/bushel, from $4.77 the previous week (-29.9% YTD)
- Wheat settled lower at $5.42/bushel, from $5.79 the previous week (-31.7% YTD)
- Soyabeans settled lower at $12.75/bushel, from $12.96 the previous week (-16.4% YTD)
![]()
Crude Palm Oil Futures Book Solid Weekly Gain
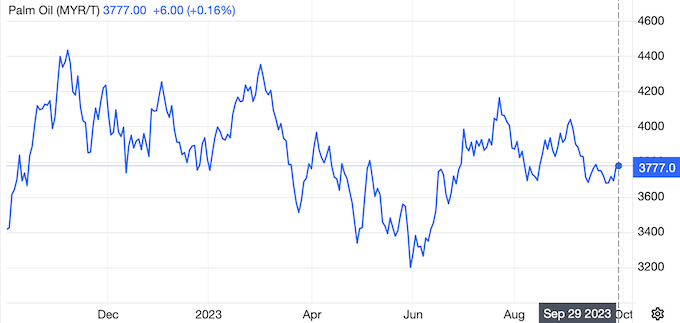
Malaysian palm oil futures hovered above MYR 3,800 per ton, approaching their highest level in near a month while pointing to around a 4% jump for the week, buoyed by strong export data. Shipments of Malaysian palm oil products for Sept. 1-25 rose 17.5% from the same period in August to 1.1 million tons, cargo surveyor Intertek Testing Services said. Meantime, independent inspection company AmSpec Agri Malaysia reported that exports of palm oil products grew by 15.2% to 1.09 million tons during the period. Simultaneously, El Nino patterns are expected to reduce output in top producer Indonesia, with a worsening drying trend likely starting to emerge in October. Limiting the upside momentum was the Golden Week holiday that already began in China as well as a caution ahead of manufacturing PMI data for September in the mainland over the weekend. Meantime, India is likely to start the 2023/24 marketing year with record inventories of edible oils that will curtail new season imports.
![]()
Baltic Exchange Dry Index Edges Down for 2nd Day, Posts Monthly Gain
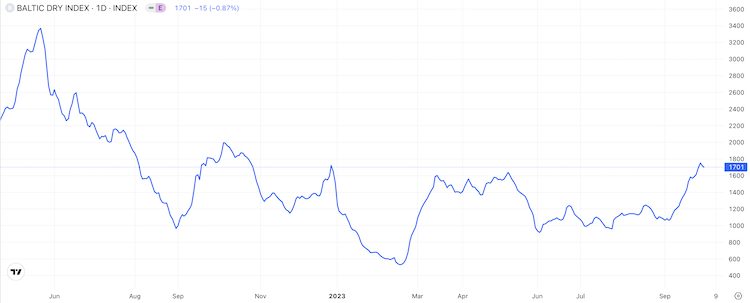
The Baltic Exchange’s dry bulk sea freight index, which measures the cost of shipping goods worldwide, eased for the second day on Friday, falling 15 points to 1,701 points, amid lower demand across all vessel segments. The capesize index, which tracks vessels typically transporting 150,000-tonne cargoes such as iron ore and coal, also was down for a second session, slipping 19 points to 2,474 points; and the panamax index, which tracks ships that usually carry coal or grain cargoes of about 60,000 to 70,000 tonnes, shed 8 points to 1,701 points. Among smaller vessels, the supramax index fell 18 points, or 1.4%, to 1,276 points. The benchmark index gained about 57% for the month, its best performance since September 2022, and also registered a quarterly gain of 56%, after having fallen the previous five quarters.

• • • • •

(Economic Excerpts from Briefing.com)
US PCE Price Index Rises the Most in 7 Months
The personal consumption expenditures price index in the US rose by 0.4% from the previous month in August of 2023, marginally below market expectations of 0.5%, but accelerating from the 0.2% increase from the two prior months. It was the sharpest monthly increase since January, suggesting that inflationary pressure in the US economy is staging a comeback due to the increase in energy prices.
US Core PCE Prices Rise the Least Since September 2021
The US core PCE price index, the Federal Reserve’s preferred gauge to measure inflation, rose by 3.9 percent annually in August 2023, the least since September 2021 and in line with market expectations. On a monthly basis, core PCE prices went up 0.1 percent, less than forecasts of 0.2 percent. When factoring in food and energy costs, the PCE price index climbed 0.4 percent from the previous month and 3.5 percent from the corresponding period in the previous year.
PCE Inflation Ticks Up to 3.5% as Expected
The personal consumption expenditure price index in the United States rose by 3.5% year-on-year in August 2023, following an upwardly revised 3.4% advance in July, matching market forecasts. Compared to the previous month, PCE prices were up 0.4% in August, after a 0.2% rise in July, slightly below market estimates of a 0.5% increase. Meanwhile, annual core PCE inflation fell to 3.9%, the lowest since September 2021, matching market forecasts, while the monthly rate eased to 0.1% from 0.2%.
US Personal Income Rises at Solid Pace
Personal income in the United States went up by 0.4% over a month in August 2023, after a 0.2% increase in July and matching the market consensus. Increases in compensation, personal income receipts on assets, rental income of persons, and proprietors’ income that were partly offset by a decrease in personal current transfer receipts.
US Personal Spending Slows as Expected
Personal spending in the US increased 0.4% month-over-month in August 2023, the least in three months, but in line with market forecasts. It follows an upwardly revised 0.9% rise in July. Spending for services increased $47 billion, led by housing, transportation services, and health care (both hospitals and outpatient services). Spending on goods rose $36.7 billion, with the largest contribution coming from gasoline, motor vehicle fuels, lubricants, and fluids, due to higher prices. Meanwhile, real PCE which is adjusted for inflation, rose 0.1%, well below 0.6% in July, as a 0.2% rise in services spending was partially offset by a 0.2% fall in spending on goods.
US Goods Trade Deficit Narrows in August, Imports Fall
The US trade deficit in goods narrowed to USD 84.3 billion in August 2023 from a USD 90.9 billion in the previous month, according to an advance estimate. Exports rose by 2.2 percent to USD 168.9 billion due to increases in sales of consumer goods (4.9 percent), industrial supplies (4.5 percent), other goods (3.5 percent) and capital goods (2.1 percent). On the other hand, the declines were seen in sales of foods, feeds & beverages (-0.1 percent) and automotive vehicles (-8.1 percent). Meanwhile, imports fell by 1.2 percent to USD 253.1 billion, primarily driven by other goods (-4.9 percent) and consumer goods (-3.4 percent).
Inflation expectations moderate in final Consumer Sentiment survey
The final reading of the University of Michigan Consumer Sentiment Index for September came in at 68.1 (consensus 67.7) versus the preliminary reading of 67.7. The final reading for August was 69.5 and one year ago in September, the reading was at 58.6.
The key takeaway from the report is that inflation expectations were revised up from their preliminary readings for the month, but they reflected some moderation in expectations when compared to final readings for August.
- The Current Economic Conditions Index rose to 71.4 from the preliminary reading of 69.8 but was down from August’s final reading of 75.7.
- The Index of Consumer Expectations fell to 66.0 from the preliminary reading of 66.3 but was up from August’s final reading of 65.5.
- Year-ahead inflation expectations ticked up to 3.2% from the preliminary reading of 3.1% but were down from August’s final reading of 3.5%.
- Five-year inflation expectations were 2.8%, up from the preliminary reading of 2.7% but down from August’s final reading of 3.0%.
Chicago PMI Disappoints in September
The Chicago Business Barometer, also known as the Chicago PMI, fell to 44.1 in September 2023 from 48.7 in August, and well below market forecasts of 47.6. The reading marked the 13th consecutive month of contraction in business activity in the Chicago region, and it was stronger than the previous month.
US Wholesale Inventories Fall For Sixth Consecutive Month
Wholesale inventories in the United states edged down by 0.1% month-over-month in August 2023, following a 0.2% fall in the prior month, preliminary estimates showed. It marks the sixth consecutive decrease in wholesale inventories, driven by a decline in non-durable goods (-0.4% vs 0.1% in July). Conversely, stocks rebounded marginally for durable goods (0.1% vs -0.4%). On a yearly basis, wholesale inventories fell by 0.9% in August.


Asian equity markets mostly rose on Friday, tracking gains on Wall Street overnight as equities got a relief from a pullback in Treasury yields, the dollar and oil prices. Shares in Australia and Hong Kong advanced, while Japanese stocks struggled for traction. Markets in South Korea and mainland China were closed for their respective holidays. Still, most benchmark indexes in Asia ended the month lower as the higher-for-longer interest rate scenario pressured equity markets throughout the period.
Friday 29 September 2023
- Japan’s September Tokyo CPI 2.8% yr/yr (last 2.9%) and Tokyo Core CPI 2.5% yr/yr (expected 2.6%; last 2.8%). August Retail Sales 7.0% yr/yr (expected 6.6%; last 7.0%), August Industrial Production 0.0% m/m (expected -0.8%; last -1.8%), August Unemployment Rate 2.7% (expected 2.6%; last 2.7%), and August jobs/applications ratio 1.29, as expected (last 1.29). August Housing Starts -9.4% yr/yr (expected -8.9%; last -6.7%) and Construction Orders -4.3% yr/yr (last 8.7%). September Household Confidence 35.2 (expected 36.2; last 36.2)
- Australia’s August Housing Credit 0.3% m/m (last 0.3%) and Private Sector Credit 0.4% m/m (expected 0.3%; last 0.3%)
Asia-Pacific Markets
The Nikkei 225 Index shed 0.05% to close at 31,858 while the broader Topix Index lost 0.94% to 2,323 on Friday, extending losses from the previous session as investors reacted to mixed economic data in Japan. Data showed that Tokyo’s core inflation rate, a leading indicator of nationwide price trends, came in at 2.5% in September, lower than the 2.6% expected by analysts. Investors also digested Japanese unemployment, industrial output and retail sales data for August. Financial stocks led the decline, with notable losses while shipping and resource-related firms also slumped. The Nikkei 225 Index dropped 2.3% for its third straight monthly decline in September, while the Topix Index shed 0.37% for the month.
The Hang Seng surged 449.55 points or 2.59% to close at 17,822.59 on Friday following a 1.5% fall in the prior session, powered by a report that China’s Vice Premier and Foreign Minister were discussing possible visits to the US to prepare for a potential summit between Xi Jinping and Joe Biden. The Hang Seng also escaped from an 11-month low hit the day before, after US stock futures surged in the wake of Thursday’s upbeat session on Wall Street, ahead of PCE data that could offer hints as to whether the Fed will raise rates further. Wins were broad-based. However, the index sank 3.1% for the month and 5.9% for the quarter, squeezed by the property crisis in China, along with fears that a climb in oil prices could lead to fresh cost pressure and an elevated interest rate environment. Markets in Hong Kong will be closed on Monday for a holiday.
The Chinese markets were closed for its Mid-Autumn Moon Festival. on Thursday, the Shanghai Composite closed at 3,110 while the Shenzhen Component inched up 0.05% to 10,110 in cautious trading, as trading volumes dried up ahead of the week-long National Data holiday. The benchmark index finished the month down 0.8% but is up 0.7% for the year.
The S&P/ASX 200 Index rose 0.34% to close at 7,049 on Friday, snapping a three-day decline, with mining stocks leading the advance amid firmer metals prices. Australian shares also tracked gains on Wall Street overnight as equities got a relief from a pullback in the dollar, Treasury yields and oil prices. Heavyweight iron ore miners led the advance along with clean energy-related stocks. Still, the benchmark index lost more than 3% in September, declining for the second straight month as the higher-for-longer interest rate scenario pressured equity markets throughout the period.
Singapore stocks track Wall Street gains on Friday; STI up 0.3%
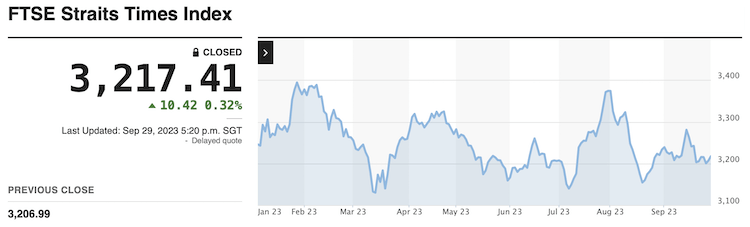
Singapore stocks ended higher on Friday (Sep 29), tracking overnight gains on Wall Street. The Straits Times Index (STI) rose 0.3 per cent or 10.42 points to 3,217.41. Across the broader market, gainers outnumbered losers 379 to 229, after 1.5 billion securities worth S$968 million changed hands. For the week, the STI is up 0.4 per cent.
Bursa ends lower on broad-based selling
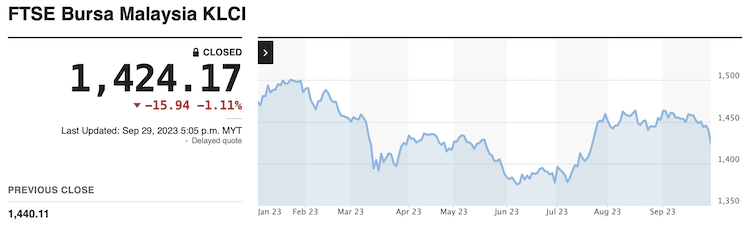
Bursa Malaysia bucked the regional trend to end the week sharply lower due to broad-based selling, said Rakuten Trade Sdn Bhd equity research vice president Thong Pak Leng. With the key index falling 1.10%, investors exercised caution due to global inflation concerns, fuelled by elevated crude oil prices and the looming US government shutdown.
The FTSE Bursa Malaysia KLCI (FBM KLCI) eased 15.94 points to 1,424.17 to mark its intraday low from Wednesday’s close of 1,440.11. The benchmark index, which opened 3.72 points easier at 1,436.39, hit an intraday high of 1,436.97 in the morning session before succumbing to selling pressure in late trading. On the broader market, decliners beat gainers 578 to 379 while 438 counters were unchanged, 990 untraded and 98 others suspended. The Main Market volume stood at 1.83 billion units worth RM2.10 billion from 1.88 billion units worth RM1.66 billion on Wednesday.
Sector-wise, the Plantation Index eased 10.89 points to 6,880.35, the Industrial Products Services Index narrowed by 1.17 points to 171.49 and the Energy Index fell 5.07 points to 893.74. The Financial Services Index tumbled 205.46 points to 15,918.17.
![]()
- Japan’s Nikkei: -0.1% (-1.7% for the week) 22.1% YTD
- Hong Kong’s Hang Seng: +2.5% (-1.4% for the week) -10.0% YTD
- China’s Shanghai Composite: CLOSED (+0.8% for the week) +0.7% YTD
- India’s Sensex: +0.5% (-0.3% for the week) +8.2% YTD
- South Korea’s Kospi: CLOSED (-3.7% for the week) +10.2% YTD
- Australia’s ASX All Ordinaries: +0.4% (-0.3% for the week) +0.4% YTD
- Malaysia’s FKLCI: -1.1% (-1.7% for the week) -4.8% YTD
- Singapore’s STI: +0.3% (+0.4% for the week) -1.0% YTD

European stocks were higher Friday, but optimism in recent sessions rounded off a weak month and the worst quarter for a year. The pan-European Stoxx 600 provisionally closed up 0.5% on the prior session, with most sectors finishing in positive territory as tech and household goods led the pack. The index ended Wednesday at a six-month low and has declined 2.1% this month, according to LSEG data, following a 2.8% fall in August. Despite making gains in July, that still takes the benchmark Stoxx to a 2.9% loss for the quarter, its worst performance for a year.
Friday 29 September 2023
- Eurozone’s September CPI 0.3% m/m (last 0.5%); 4.3% yr/yr (expected 4.5%; last 5.2%). September Core CPI 0.2% m/m (last 0.3%); 4.5% yr/yr (expected 4.8%; last 5.3%)
- Germany’s August Retail Sales -1.2% m/m (expected -0.7%; last -2.2%); -2.3% yr/yr (expected -0.7%; last -2.2%). August Import Price Index 0.4% m/m (expected 0.5%; last -0.6%); -16.4% yr/yr, as expected (last -13.2%). September Unemployment Change 10,000 (expected 15,000; last 20,000) and Unemployment Rate 5.7%, as expected (last 5.7%)
- France’s August PPI 0.6% m/m (last -0.3%); -1.3% yr/yr (last 0.9%). August Consumer Spending -0.5% m/m, as expected (last 0.4%). September CPI -0.5% m/m (expected -0.3%; last 1.0%); 4.9% yr/yr (expected 5.1%; last 4.9%)
- U.K.’s August Mortgage Lending GBP1.22 bln (last GBP200 mln) and August BoE Consumer Credit GBP1.644 bln (expected GBP1.300 bln; last GBP1.271 bln). Q2 GDP 0.2% qtr/qtr, as expected (last 0.3%); 0.6% yr/yr (expected 0.4%; last 0.5%). Q2 Business Investment 4.1% qtr/qtr (expected 3.4%; last 4.0%); 9.2% yr/yr (expected 6.7%; last 7.0%). Q2 Current Account deficit GBP25.3 bln (expected deficit of GBP15.0 bln; last deficit of GBP15.2 bln)
- Italy’s September CPI 0.2% m/m (expected 0.1%; last 0.3%); 5.3% yr/yr, as expected (last 5.4%). July Industrial Sales -0.4% m/m (last 0.5%); -1.6% yr/yr (last -0.4%)
- Spain’s July Current Account surplus EUR4.27 bln (last surplus of EUR2.83 bln)
- Swiss September KOF Leading Indicators 95.9 (expected 90.5; last 96.2)
European Stocks Rise on Friday,
DAX Posts Worst Month in a Year
European equity markets rose on Friday, with the German DAX up 0.4% and the benchmark Stoxx 600 adding 0.5%, as investors were digesting a batch of inflation data from the Eurozone. The latest CPI report showed that inflation across the 20 countries that use the euro slowed more than expected to 4.3% in September, marking the lowest rate since October 2021, and the core inflation rate cooled to an over one-year low of 4.5%. These data points indicated that easing inflationary pressures were beginning to materialise, even though both rates remained well above the ECB’s 2% target.
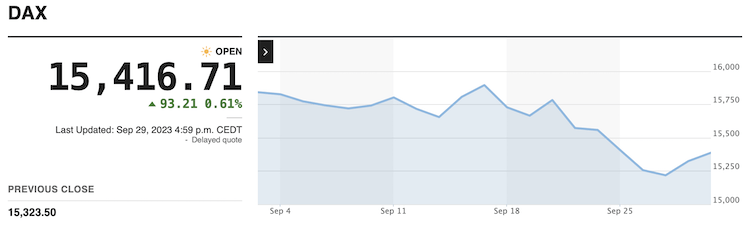
Despite Friday’s gains, the German DAX 40 lost 3.5% in September, the most in a year, due to concerns that interest rates are likely to remain elevated for an extended period.
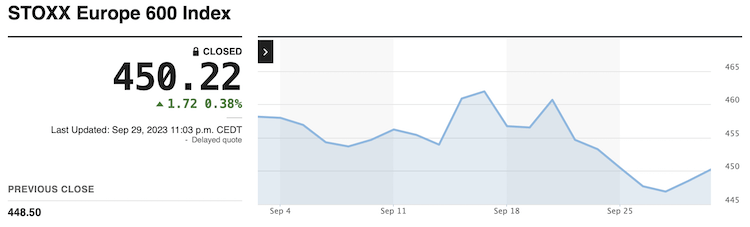
The STOXX 600 dropped 1.6% in September and fell by 2.9% in Q3, its worst performance for a year.
UK Shares Close Flat on Friday
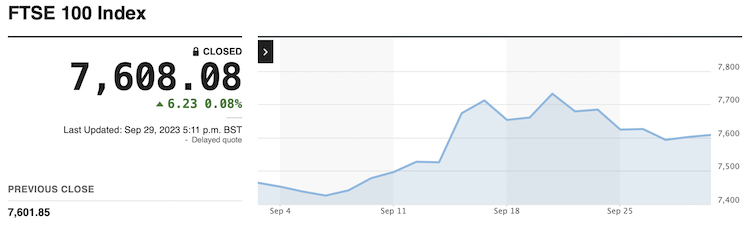
The FTSE 100 index trimmed early gains and closed 0.1% higher at 7,608 on Friday, trimming losses from earlier in the week as Gilts enjoyed some respite and investors tamed their concerns of a hawkish Fed and an unstable Chinese economy. Revised data showed that the UK GDP grew more than expected in the second quarter of the year, raising hopes that the British economy may continue to operate in a slight expansion despite the high Bank Rate from the BoE. On the other hand, net lending advanced more than markets expected, adding leeway for hawkish policy. Industrial miners booked gains ahead of China’s Golden Week festivities, with Glencore adding 2%. At the same time, JD Sports advanced 5% amid strong results from Nike, while Severn Trent soared 3.5% after pledging to invest GBP 12.9 billion by 2030. Still, the index dropped 1% on the week.
![]()
- U.K.’s FTSE 100: +0.1% (-1.0% week-to-date) +2.1% YTD
- Germany’s DAX: +0.4% (-1.1% week-to-date) +10.5% YTD
- France’s CAC 40: +0.3% (-0.7% week-to-date) +10.2% YTD
- Italy’s FTSE MIB: +0.3% (-1.2% week-to-date) +19.1% YTD
- Spain’s IBEX 35: +0.0% (-0.8% week-to-date) +14.6% YTD
- STOXX Europe 600: +0.4% (-0.7% week-to-date) +6.0% YTD

• • • • •

That’s A Wrap!
I started the Daily Market Analysis way back in 2005 when we didn’t even have social media platforms, and using a public forum to post my daily reports. It’s been one heck of a trading diary and one that I’ve been proud of for 18 years. There were times when my students like Jason Lee, Pierre Vignaud and several others took over the DMA so that they could put themselves on the line and improve on their analysis. It is something that I still advocate amongst my PTT Alumni because it sharpens your read on the market.
But the time has come to call it a day on the DMA, WMO and MMO. The reason is a simple one – I’m retiring.
After this posting, there’s only the MMO for October left and then it’s done and dusted.
I hope that the daily postings have helped you in some way to understand the financial markets a little bit more and encourage you to do your own daily analysis, or at least a weekly one, to sharpen your read on the market. 18 years is a long time of commitment but everything comes to an eventual end. It has been my privilege to have had you as an audience (even if you didn’t agree with all my analyses) and wish you all, all the best and Happy Hunting, always!