The ETF Screener is a paid analytical tool at $0.10¢ per ETF screen, hosted at Pattern Trader™ Tools.
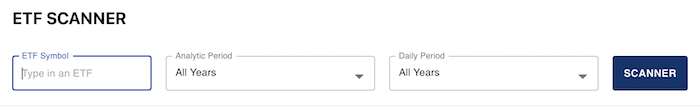
The ETF Screener is specifically for gathering information and statistics for Exchange Traded Funds (ETFs) listed in the U.S. market. It is necessary for the user to already know the ticker symbol of the ETF that they are screening for. For those not in the know, you may want to use this search function before starting your screen.
Type in the ticker symbol as into the first entry box, “ETF Symbol” then select the “Analytical Period” from the drop-down menu. Analytical periods can be screened for 5, 10, 15 and 20 year averages for monthly and weekly factors. Do the same for the “Daily Period” selection as well.
After hitting the “Screen” button, the snap shot and fundamentals of the ETF will appear as illustrated below. For an explanation of the fundamental items listed, go to our Glossary of Common Financial Terms.
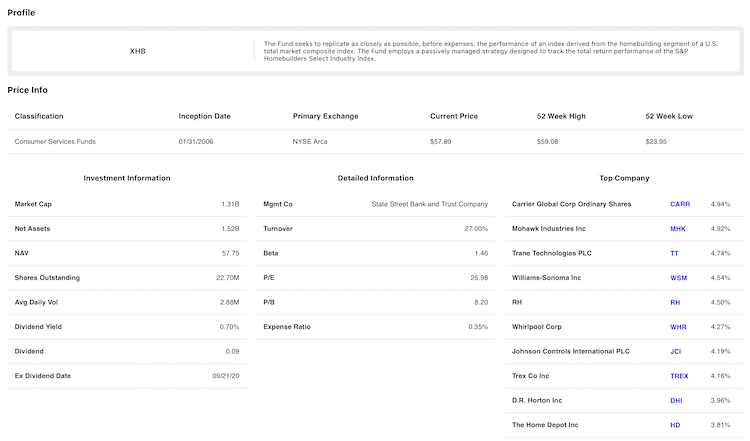
The top 10 holdings of the ETF will be featured on the right, listed from largest to smallest in terms of their percentage weight relative to the rest of the holdings in the ETF. Clicking on any ticker symbol will bring you to the Full Stock Screener. This is a paid analytical tool at $0.10¢ per stock screen.
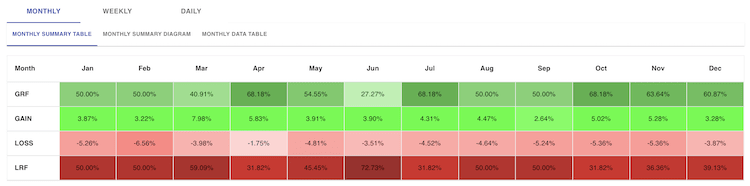
Screening For Monthly Factors
Each security will feature the monthly probabilities for bullishness (GRF) or bearishness (LRF) as well as the average percentage gain (Gain) or loss (Loss) over specific periods. (RF = Reliability Factor)
The varying shades of colour are meant to emphasise the gravity of the RF – lighter implies that the reliability factor is lower while darker implies that the reliability factor is higher. Likewise, the darker shade on the Gain or Loss implies that the gains or losses were greater on average.
For those who prefer graphs, the Monthly Summary Diagram shows the user the Gains and Losses as columns and the RFs as dotted trend lines. There is also a slider on the left of the graph that makes it easier to identify various levels of gains or losses.
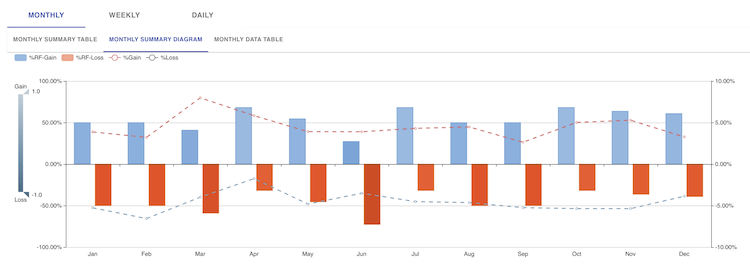
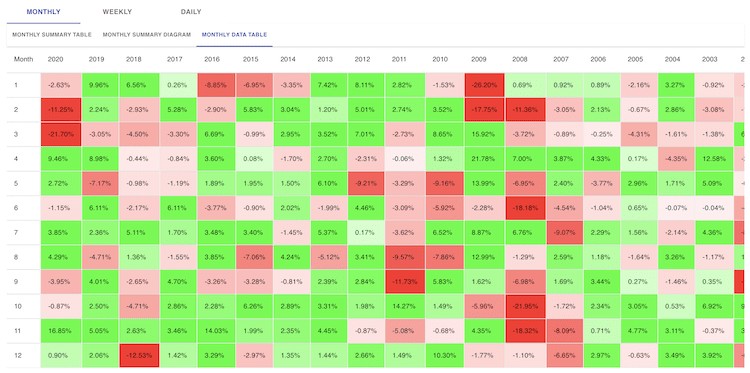
The Monthly Data Table is the source from which all tables are derived. It features all the monthly historical statistics over all the varying years.
Screening For Weekly Factors
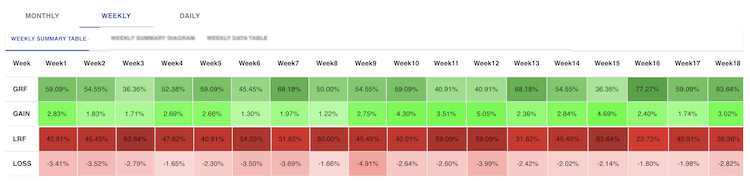
All 52 weeks of the year are featured with their weekly probabilities for bullishness (GRF) or bearishness (LRF) as well as the average percentage gain (Gain) or loss (Loss) over specific periods. (RF = Reliability Factor)
The varying shades of colour are meant to emphasise the gravity of the RF – lighter implies that the reliability factor is lower while darker implies that the reliability factor is higher. Likewise, the darker shade on the Gain or Loss implies that the gains or losses were greater on average.
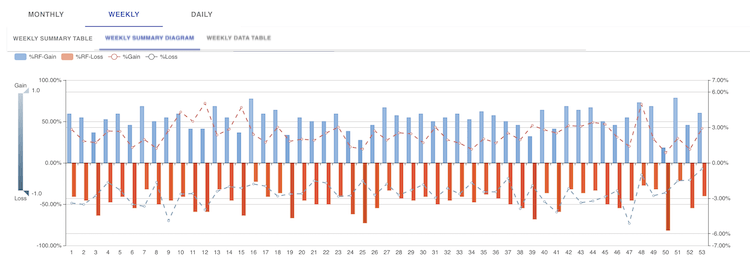
For those who prefer graphs, the Weekly Summary Diagram shows the user the Gains and Losses as columns and the RFs as dotted trend lines. There is also a slider on the left of the graph that makes it easier to identify various levels of gains or losses.
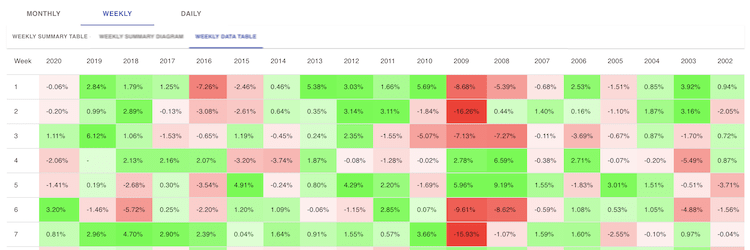
The Weekly Data Table is the source from which all tables are derived. It features all the weekly historical statistics over all the varying years.
Screening For Daily Factors
Every historical trading day of the security is featured with their daily probabilities for bullishness (GRF) or bearishness (LRF) as well as the average percentage gain (Gain) or loss (Loss) over specific periods. (RF = Reliability Factor)
The varying shades of colour are meant to emphasise the gravity of the RF – lighter implies that the reliability factor is lower while darker implies that the reliability factor is higher. Likewise, the darker shade on the Gain or Loss implies that the gains or losses were greater on average.
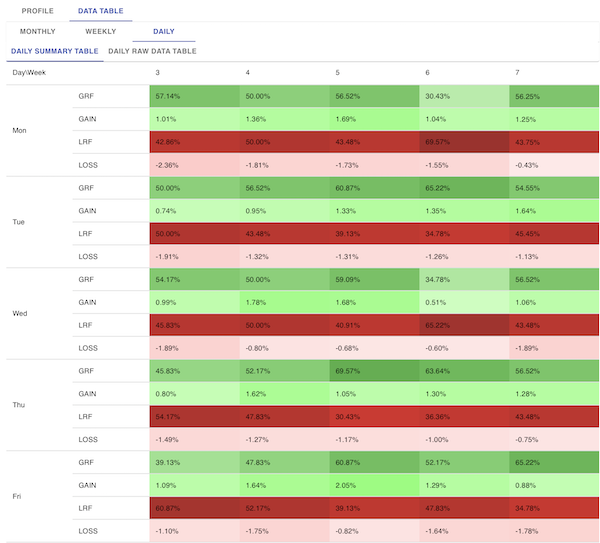
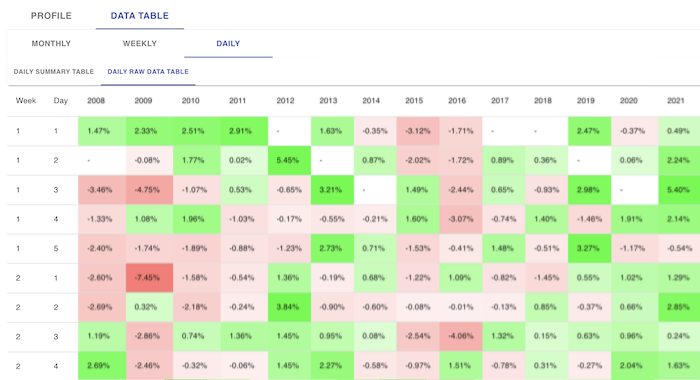
The Daily Data Table is the source from which all tables are derived. It features all the daily historical statistics over all the varying years.
Some Interesting Tid-Bits …
- Having a huge percentage RF may not be worth the risk if the average returns are below your risk appetite. In other words, would you take a risk if you had an RF of 80% if the average returns were +0.2% while the opposing 20% offers -9.9%?
- For the low risk takers, we strongly advise that you stick to high RFs with high average percentage returns. An RF of more than 70% is actually very good.
- It is strongly recommended that you not simply rely on weekly RFs to make your short-term trading analysis because one day in a week with an abnormal percentage anomaly can make a weekly statistic misleading. Always drill down to the daily RFs for a clearer and safer analysis
Terms & Conditions of Use
- The ETF Screener is a paid analytical tool at $0.10¢ per ETF screen, hosted at Pattern Trader™ Tools.
- If a screen is made on a stock, there are no charges for screening the same stock within the next 120 minutes (2 hours).
- The account will be charged for another screen of the same stock after 120 minutes (2 hours) of the first screen.
- Clicking on any ticker symbol will bring you to the Full Stock Screener. This is another paid analytical tool. Each stock screen will cost $0.10¢ per screen.
- To create an account, simply click on the “TOP UP” command in the left menu panel and select the desired value.
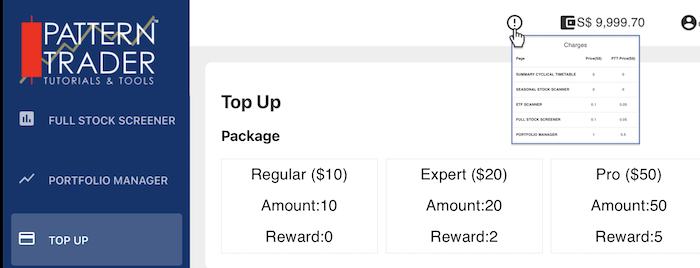
- The packages are in Singapore Dollars (SGD).
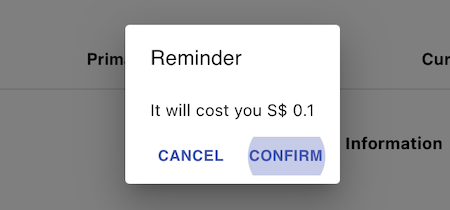
- You will be prompted to accept the charges before any deduction is made from your wallet.
- The “PTT Price (S$)” at $0.05¢ per ETF is for graduates of the Pattern Trader™ Tutorial.
- The “Reward” is an additional value of bonus dollars added to your wallet for purchasing a higher value.
- Packages are listed as;
- Regular ($10) = 100 screens (PTT Grads: 200 screens)
- Expert ($20) + Reward ($2) = 220 screens (PTT Grads: 440 screens)
- Pro ($50) + Reward ($5) = 550 screens (PTT Grads: 1,100 screens)
- Your wallet’s balance (in SGD) is indicated at the top right of the screen next to your account icon.
DISCLAIMER:
The information contained herein is subject to change without notice and was obtained from sources believed to be reliable, but is not guaranteed as to accuracy or completeness. Those using the materials for trading purposes are responsible for their own actions. No guarantee is made that trading signals or methods of analysis will be profitable or will result in losses. It should not be assumed that performance would equal or exceed past results.