The Seasonal Summary Table, , hosted at Pattern Trader™ Tools, is the starting point of your sector research. The table provides you with an overview of favourable and unfavourable periods to trade specific sectors and/or industries.
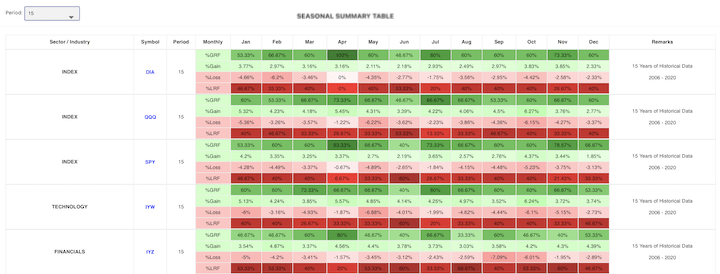
The table features the Exchange Traded Funds (ETFs) for the three benchmark indices and 13 various sectors and industries that generally make up the U.S. market. These sectors and industries are represented by a selection of preferred ETFs based on their liquidity, portfolio holdings and balance (portfolio weight).
The sector/industry ETFs are listed alphabetically according to the title of the sector or industry. They are as follows:
-
- DIA : SPDR Dow Jones Industrial Average ETF Trust (NYSEARCA)
- SPY : SPDR S&P 500 ETF Trust (NYSEArca)
- QQQ : Invesco QQQ Trust (NasdaqGM)
- PPA : Invesco Aerospace & Defense ETF (NYSEArca)
- XLY : Consumer Discretionary Select Sector SPDR Fund (NYSEArca)
- XLP : Consumer Staples Select Sector SPDR Fund (NYSEArca)
-
XLE : Energy Select Sector SPDR Fund (NYSEArca)
-
XLF : Financial Select Sector SPDR Fund (NYSEArca)
- XLV : Health Care Select Sector SPDR Fund (NYSEArca)
- XHB : SPDR S&P Homebuilders ETF (NYSEArca)
- XLI : Industrial Select Sector SPDR Fund (NYSEArca)
- XLB : Materials Select Sector SPDR Fund (NYSEArca)
- XRT : SPDR S&P Retail ETF (NYSEArca)
- IYW : iShares U.S. Technology ETF (NYSEArca)
- IYZ : iShares U.S. Telecommunications ETF (BATS)
- XLU : Utilities Select Sector SPDR Fund (NYSEArca)
Each security will feature the monthly probabilities for bullishness or bearishness (%RF) as well as the average gains (%Gain) or losses (%Loss) over the period of the ETF since its inception. (RF = Reliability Factor)
The varying shades of colour are meant to emphasise the gravity of the %RF – lighter implies that the factor is lower while darker implies that the factor is higher. Likewise, the darker shade on the %Gain or %Loss implies that the gains or losses were greater on average.
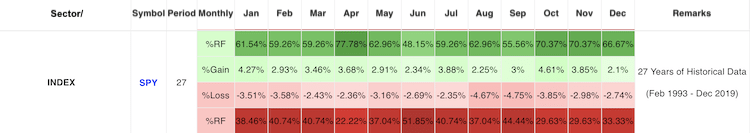
In the table above for the SPY, The month of April represents the most bullish opportunity as it carries a 77.78% reliability factor over the last 27 years. Average gains for April have been around +3.68%. On the bearish side of April, there is only a 22.22% chance of a correction. If it happens, losses could average -2.36%.
For longer term planning, the months between October and January have been very favourable to the bulls. With the exception of December, the average returns have been higher than the risks with the reliability factor averaging around 67% for the four months.
Some Interesting Tid-Bits …
- June is typically the poorest month for the bulls across all sectors and industries with Materials and Financial faring the worst.
- April is usually the most bullish month for most securities
- Housing and Construction has its best period during the “Best Six Months” on the S&P500 between November and April
- Aerospace & Defense have the most number of bullish months with the highest %Gains amongst all the ETFs
- The Retail industry is NOT as bullish in November and December as commonly perceived
- Technology is the most boring sector with 11 out of 12 months’ %RF below 70% for the bulls. But the month of October carries the highest %Gain of any security at +8.94% over a 20-year average.
Terms & Conditions of Use
- The Seasonal Summary Table is free to use for everyone.
- Simply register an account at Pattern Trader™ Tools to login and start using the table.
- Clicking on any ticker symbol will bring you to the ETF Screener.
- The ETF Screener is a paid analytical tool.
- Each screen will cost $0.10¢ per ETF.
Join us at our Facebook discussion group: Pattern Trader™ Tools on Facebook
DISCLAIMER: The information contained herein is subject to change without notice and was obtained from sources believed to be reliable, but is not guaranteed as to accuracy or completeness. Those using the materials for trading purposes are responsible for their own actions. No guarantee is made that trading signals or methods of analysis will be profitable or will result in losses. It should not be assumed that performance would equal or exceed past results.