
Thursday 28 September 2023 AMC
Stocks find their way amid interest rate volatility
The stock market experienced some choppiness in the early going, but quickly found some upside momentum following yesterday’s afternoon bounce. The positive bias stemmed from a belief that the stock market is due for a bounce after suffering steep losses in September. The major indices all registered gains, but closed off their highs of the day. The S&P 500 finished just a whisker shy of 4,300.

Market breadth showed advancers outpacing decliners by a better than 2-to-1 margin at the NYSE and by a roughly 13-to-8 margin at the Nasdaq. The Invesco S&P 500 Equal Weight ETF (RSP) rose 0.7% versus a 0.6% gain for the market-cap weighted S&P 500.
True to September form, the price action in the Treasury market was a big directional driver for stocks. The 10-yr note yield fell to 4.59% in overnight action before spiking to 4.68% following this morning’s initial jobless claims and revised Q2 GDP reports. It settled the session at 4.60%, down three basis points from yesterday.
The 2-yr note yield also saw some volatility before settling at 5.04%, which is six basis points below yesterday’s settlement. Gains in the Treasury market were likely also driven by a belief that it is oversold on a short-term basis and also due for a bounce.
Even when market rates hit their highs of the session, stocks were holding up fairly well. Presumably, that was viewed as a positive development that invited additional rebound interest.
Some mega caps had been trading down in the early going, limiting index performance. Apple (AAPL) and Microsoft (MSFT) were among the influential laggards, down 1.7% and 1.1%, respectively, at their lows of the day. They would rebound as would other mega cap stocks. The Vanguard Mega Cap Growth ETF (MGK) rose 0.6%.
Semiconductor stocks were a notable pocket of strength. The PHLX Semiconductor Index (SOX) rose 1.8%. Micron (MU) was the only SOX component to close in the red, trading down after its earnings report.
Ten of the 11 S&P 500 sectors logged a gain. The communication services sector (+1.2%) led the outperformers while the rate-sensitive utilities sector (-2.2%) logged the biggest decline.
- Nasdaq Composite: +26.1% YTD
- S&P 500: +12.0% YTD
- S&P Midcap 400: +3.3% YTD
- Dow Jones Industrial Average: +1.9% YTD
- Russell 2000: +1.6% YTD

All major US stocks indexes were trading higher on Thursday afternoon, with the Dow Jones adding more than 100 points, while the S&P 500 and the Nasdaq were up by 0.7% and 1%, respectively. Investors digested a slew of economic data while Treasury yields slipped from multi year highs.
- DOW closed higher at 33666 (+0.35%)
- NASDAQ closed higher at 13201 (+0.83%)
- S&P 500 closed higher at 4300 (+0.59%)
- In-line average volume
- NYSE 908 mln vs avg. of 907 mln
- NASDAQ 4,732 mln vs avg. of 4,877 mln
- Advancing/declining volume
- NYSE 646 mln/250 mln
- NASDAQ 2,956 mln/1,751 mln
- Advancers led decliners
- NYSE 1,996/900
- NASDAQ 2,656/1,680
- In-line average volume
Thursday 28 September 2023 After-hours Action
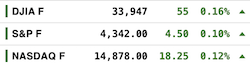
Index futures were looking optimistic four-hours into the close on Thursday night.
Early Selling Reversed
U.S. Treasuries ended Thursday on a mostly higher note, but not before early pressure lifted yields on 5s and longer tenors to fresh highs for the year. Longer-dated Treasuries started the day in flat fashion, but selling pressure showed up immediately after the cash open, lifting yields past yesterday’s highs with the 30-yr yield overtaking its peak from 2011 (4.789%). Longer tenors underperformed in early trade while the 2-yr note started ahead and finished in the lead. The intraday bounce produced highs in the early afternoon, even though the U.S. Treasury’s final note auction of the week, which was a $37 bln 7-yr note sale, met weaker demand than yesterday’s 5-yr note offering.
-
Bond Yields after the close on Thursday 28 September:
- 3-mth: -2 bps to 5.56%
- 2-yr: -6 bps to 5.04%
- 5-yr: -5 bps at 4.62%
- 10-yr: -2 bps to 4.59%
- 30-yr: -2 bps to 4.71%
The yield curve fell with its short-term maturity yields falling more than its long-term counterparts.
The inverted 2-year/10-year yield spread narrowed to -45 bps from -49 bps the previous session.
- The current inversion of the 2/10 which began on Tuesday 5 July 2022 is now three-hundred and twelve sessions old, making it the longest period of inversion in 42 years.
- The current inverted 2y/10y spread at -107 bps, printed on Wednesday 08 March 2023, surpassed the previous widest spread printed on Tuesday 07 March 2023 at -103 bps.
- One needs to go back all the way to October 1981 to see a steeper inversion than the current one.
The inverted 3-month/10-year yield spread remained unchanged at -97 bps from -97 bps the previous session.
- The inverted 3m/10y spread that began on 25 October, is now two hundred and thirty-three sessions old, making it the longest inversion in 42 years.
- –189 bps printed on Thursday 01 June and Thursday 04 May is the widest inverted spread on the 3m/10y, surpassing the -188 bps printed on Wednesday 01 June and Wednesday 03 May 2023, making it the steepest inversion in 42 years.
- -189 bps surpasses all the previous inverted 3m/10y spreads over the past 50+ years.
The inverted 10-year/Federal Funds Rate spread narrowed to -72 bps on Wednesday 27 September from -77 bps on Tuesday 26 September.
- The current 10y/FFR inversion which began on Tuesday 15 November 2022 is two hundred and seventeen sessions old.
- The -171 bps spread on Thursday 04 May 2023 surpasses the -153 bps spread printed on Wednesday 05 and Thursday 06 April 2023 as the widest of the current inversion in over 22 years.
- The current inversion has surpassed the previous two inversions;
- May 2019 to March 2020
- July 2006 to January 2008
- One needs to go back to 02 January 2001 for a deeper inversion when the 10-year/FFR was at -175 bps.
- By my estimation, the inverted 10y/FFR spread would have widened to -74 bps on Thursday 28 September 2023.
![]()
The U.S. Dollar Index fell 0.4% to 106.22, surrendering Wednesday’s gain.
- Currencies Majors:
- EUR/USD: +0.5% to 1.0553
- GBP/USD: +0.5% to 1.2195
- USD/CNH: -0.3% to 7.2955
- USD/JPY: -0.2% to 149.25
Crude Oil Eases Below $92
WTI crude futures fell below $92 per barrel on Thursday, after rising to as high as $95, as traders took profits and some worried that high interest rates may weigh on oil demand. Earlier, a sharp decline in US crude stockpiles exacerbated concerns about tight global supplies and sent oil prices to the highest level in over a year. On Wednesday, official data showed that US crude inventories fell by 2.2 million barrels last week, much more than market expectations for a 320,000-barrel draw. Crude stocks at the key Cushing, Oklahoma storage hub also dropped to the lowest level since July 2022. The market has already been grappling with tightening global supply heading into winter as OPEC+ majors Saudi Arabia and Russia extended supply cuts through the year’s end. The Russian government also said on Wednesday it is considering restricting grey fuel exports and raising fuel export duty for resellers.
- Crude Oil futures fell $2.36 (-2.51%) to $91.57/barrel
- Nat Gas $0.03 rose (1.2%) to $2.95/MMBtu
- Gold settled today’s session down $11.90 (0.63%) at $1,878.90/oz
- Silver settled today’s session $0.01 higher (0.07%) at $22.71/oz
- Copper settled $0.07 higher (2.04%) at $3.70/lb
Weekly EIA Natural Gas Inventories showed a build of 90 bcf vs a build of 64 bcf last week
Working gas in storage was 3,359 Bcf as of Friday, September 22, 2023, according to EIA estimates. This represents a net increase of 90 Bcf from the previous week. Stocks were 397 Bcf higher than last year at this time and 189 Bcf above the five-year average of 3,170 Bcf. At 3,359 Bcf, total working gas is within the five-year historical range.
![]()
Baltic Exchange Dry Index Breaks 4-Day Gain
The Baltic Exchange’s dry bulk sea freight index fell about 2.1% to 1,716 points on Thursday, after four consecutive sessions of gains that sent the index to the highest since October 25th. The capesize index, which tracks vessels typically transporting 150,000-tonne cargoes such as iron ore and coal, snapped its four-day winning streak, slipping from its over four-and -a-half month peak by 83 points, or 3.2% to 2,493 points. At the same time, the panamax index, which tracks ships that usually carry coal or grain cargoes of about 60,000 to 70,000 tonnes, edged down 2 points to 1,709 points; and the supramax index shed 24 points, or 1.8%, to 1,294 points.
• • • • •

(Economic Excerpts from Briefing.com)
Initial jobless claims still looking good for labor market
Initial claims for the week ending September 23 increased just 2,000 to 204,000 (consensus 215,000). Continuing jobless claims for the week ending September 16 increased by 12,000 to 1.670 million.
The key takeaway from the report is that the low level of initial claims – a leading indicator – continues to fit the framework of a tight labor market.
- The four-week moving average for initial claims decreased by 6,250 to 211,000.
- The four-week moving average for continuing claims decreased by 12,250 to 1,673,750.
- The total number of continued weeks claimed for benefits in all programs for the week ending September 9 was 1,669,542, a decrease of 9,347 from the previous week. In the same week a year ago, there were 1,302,447 weekly claims filed for benefits in all programs.
Q2 GDP the same with third estimate, but GDP Deflator better
The third estimate for Q2 GDP was unchanged from the second estimate at 2.1%, as expected. The GDP Deflator, though, saw a friendly downward revision to 1.7% (consensus 2.0%) from 2.0%. Benchmark revisions showed real GDP increased at an annual rate of 5.6% from the second quarter of 2020 through the first quarter of 2023, 0.2 percentage point lower than previously indicated.
The key takeaway from the report was the improved deflator reading. The 1.7% increase was the lowest since the second quarter of 2020.
- Personal consumption expenditure growth was cut to 0.8% from 1.7% in the second estimate and contributed 0.55 percentage points to growth.
- Gross private domestic investment was revised up to 5.2% from 3.3% in the second estimate and contributed 0.90 percentage points to growth.
- Exports declined 9.3% versus a 10.6% decline in the second estimate. Imports declined 7.6% versus a 7.0% decline in the second estimate. Net exports added 0.04 percentage points to growth.
- Government spending growth was 3.3%, unchanged from the second estimate, and contributed 0.57 percentage points to growth.
- Real final sales of domestic product, which excludes the change in private inventories, was 2.1% versus 2.2% in the second estimate.
- The personal savings rate as a percentage of disposable personal income was revised higher to 5.2% from 4.5% in the second estimate.
- Profits of domestic nonfinancial corporations increased $39.0 billion in Q2, an upward revision of $21.9 billion.
- The core-PCE Price Index was up 3.7% in Q2, unchanged from the second estimate, versus 5.0% in the first quarter.
- Q1 real GDP was revised up to 2.2% from 2.0%.
US Corporate Profits Rise Less than Initially Thought
Corporate profits in the United States increased 0.5 percent to USD 2.60 trillion in the second quarter of 2023, less than preliminary estimates of a 1.6 percent rise and following a 4.1 percent fall in the previous period. Net cash flow with inventory valuation adjustment, the internal funds available to corporations for investment, rose 1 percent to USD 3.20 trillion, and net dividends went up 0.8 percent to USD 1.86 trillion. Meanwhile, undistributed profits fell 0.3 percent to USD 0.75 trillion.
US Pending Home Sales Fall Most in Almost a Year
Pending home sales in the United States plummeted by 7.1% month-over-month in August 2023, marking the steepest decline since September 2022 and significantly surpassing the market’s expectations of a 0.8% decrease. Across various US regions, contract signings were down in the South (-9.1%), West (-7.7%), Midwest (-7.0%), and Northeast (-0.9%). High-interest rates have pushed mortgage rates above 7%, impacting homebuying by reducing the pool of potential buyers. Consequently, many buyers found themselves needing to recalibrate their expectations regarding the location and type of home they can afford. In a year-over-year comparison, pending sales decreased by 18.7%, a faster rate than observed in the previous month.
US Mortgage Rates Hit 2000-Highs
The average rate on a 30-year fixed mortgage was at 7.31% as of September 28th 2023, the highest since 2000, up from last week when it averaged 7.19%, tracking the rise in US Treasury yields. The average mortgage rate was at 6.70% in the corresponding week of the previous year. “The 30-year fixed-rate mortgage has hit the highest level since the year 2000,” said Sam Khater, Freddie Mac’s Chief Economist. “However, unlike the turn of the millennium, house prices today are rising alongside mortgage rates, primarily due to low inventory. These headwinds are causing both buyers and sellers to hold out for better circumstances.”

NIKE (NKE) beats by $0.18, reports revs in-line, gross margin decreased 10 bps to 44.2%, inventories down 10% yr/yr to $8.7 bln.
- Reports Q1 (Aug) earnings of $0.94 per share, $0.18 better than the FactSet Consensus of $0.76; revenues rose 1.6% year/year to $12.9 bln vs the $13 bln FactSet Consensus.
- Wholesale revenues were $7.0 billion, flat compared to prior year on a reported basis and up 1 percent on a currency-neutral basis.
- Gross margin decreased 10 basis points to 44.2 percent.
- Inventories for NIKE, Inc. were $8.7 billion, down 10 percent compared to the prior year, primarily driven by a decrease in units, partially offset by product mix and higher product input costs.
- Selling and administrative expense increased 5 percent to $4.1 billion.


- India’s Q2 Current Account Deficit $9.20 bln (expected deficit of $8.90 bln; last deficit of $1.30 bln)
- Australia’s August Retail Sales 0.2% m/m (expected 0.3%; last 0.5%)
- New Zealand’s September ANZ Business Confidence 1.5 (last -3.7) and NBNZ Own Activity 10.9% (last 11.2%)
- Large investment funds sold a record amount of Japanese stocks during the past week.
- The People’s Bank of China injected more liquidity and continued fixing the yuan at a higher level.
- Shares of Evergrande were suspended in Hong Kong after the company’s chairman was detained.
- Japan’s Finance Minister Suzuki said that the currency market is being watched with “a strong sense of urgency.”
Equity indices in the Asia-Pacific region ended Thursday on a mixed note while markets in South Korea were closed for a holiday. China managed to inch higher by 0.1% while Japan sank 1.5%. The Shanghai Composite saw a lackluster session on a day with no significant economic data released and ahead of its Mid-Autumn Moon Festival. Some speculation surrounding the yen intervention in Japan seemed to put a crimp into sentiment. Heavyweights were a drag, with names like Tokyo Electron, Toyota, and SoftBank shedding 1-2%.
- Japan’s Nikkei: -1.5%
- Hong Kong’s Hang Seng: -1.4%
- China’s Shanghai Composite: +0.1%
- India’s Sensex: -0.9%
- South Korea’s Kospi: CLOSED
- Australia’s ASX All Ordinaries: -0.1%
- Malaysia’s FKLCI: -0.4%
- Singapore’s STI: +0.2%

- Eurozone’s September Business and Consumer Survey 93.3 (expected 92.5; last 93.6)
- Italy’s September Business Confidence 96.4 (expected 97.8; last 97.7) and Consumer Confidence 105.4 (expected 105.5; last 106.5). August PPI 0.5% m/m (last -0.1%); -12.2% yr/yr (last -10.2%)
- Spain’s September CPI 0.2% m/m (expected 0.3%; last 0.5%); 3.5% yr/yr, as expected (last 2.6%). August Retail Sales 7.2% yr/yr (last 7.3%). September Business Confidence -8.7 (last -6.6)
- Germany’s economic institutes lowered their 2023 GDP forecast to -0.6% from +0.3%.
- There were renewed concerns about Italy’s fiscal standing after the country’s budget for 2024 showed the deficit-to-GDP ratio increasing to 4.3% from 3.7%.
- France may impose a windfall tax on energy companies.
Equity markets in Europe rose on Thursday, snapping a five-day losing streak thanks to a bigger-than-anticipated drop in inflation in Germany. Preliminary data showed that Germany’s consumer inflation rate in September was 4.5%, which was slightly below what the market had been expecting at 4.6%. However, the situation in Spain painted a different picture, as their inflation rate continued to climb for the third consecutive month, reaching 3.5%, the highest level seen since April. The German DAX added 0.7% and the benchmark Stoxx 600 went up 0.3%, led by the basic resources sector and banks.
Equities in London benefited from a late increase and closed near the flatline at 7,601 on Thursday, but held the muted momentum over the week as concerns that interest rates shall stay elevated for a prolonged period pressured British equities. Data pointing to a tight labor market in the US restoked fears of tight monetary policy from the Federal Reserve, triggering a fresh selloff UK Gilts. Sentiment was also hurt by the suspension of Evergrande’s trading in Hong Kong, adding to fears of financial contagion throughout China’s property sector and pressuring stocks with exposure in London.
- U.K.’s FTSE 100: +0.1%
- Germany’s DAX: +0.7%
- France’s CAC 40: +0.6%
- Italy’s FTSE MIB: +0.5%
- Spain’s IBEX 35: +1.0%
- STOXX Europe 600: +0.4%
• • • • •

Friday 29 September 2023
The last trading day in September has been down on SPX 16 of the last 25 but up 5 of the last 7 (last year down).
The Stock Trader’s Almanac’s stats for the Benchmark Indices for Friday of Week 39 over a 21-year average are;
- Dow Jones (DJIA): Bearish 57.1%
- S&P 500 (SPX): Bearish 61.9%
- NASDAQ (COMP): Mildly Bearish 52.4%
![]()
The Pattern Trader™ Tools Screener stats for the Benchmark Index ETFs for Friday of Week 39;
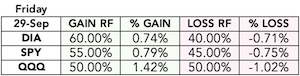
- SPDR DJIA ETF Trust (DIA – 19yr Avg): Bullish 60.00%
- SPDR S&P 500 ETF Trust (SPY – 19yr Avg): Bullish 55.00%
- Invesco QQQ Trust Series I (QQQ – 13yr Avg): Flat-to-Bullish 50.00%
Friday September 29
- Australia – Private Sector Credit m/m
- Japan – Tokyo Core CPI y/y, Unemployment Rate, Prelim Industrial Production m/m, Retail Sales y/y, Consumer Confidence, Housing Starts y/y
- UK – Current Account, Final GDP q/q, Revised Business Investment q/q, M4 Money Supply m/m, Mortgage Approvals, Net Lending to Individuals m/m
- EU –
- ECB President Lagarde Speaks
- Eurozone CPI Flash Estimate y/y, Core CPI Flash Estimate y/y
- German Unemployment Change
- French Consumer Spending m/m, Prelim CPI m/m
- Italian Prelim CPI m/m
- US –
- August Personal Income (prior 0.2%) at 8:30 ET
- Personal Spending (prior 0.8%) at 8:30 ET
- PCE Prices (prior 0.2%) at 8:30 ET
- Core PCE Prices (prior 0.2%) at 8:30 ET
- Advance goods trade balance (prior -$91.2 bln) at 8:30 ET
- Advance Retail Inventories (prior 0.3%) at 8:30 ET
- Advance Wholesale Inventories (prior -0.1%) at 8:30 ET
- September Chicago PMI (prior 48.7) at 9:45 ET
- Final September University of Michigan Consumer Sentiment (prior 67.7) at 10:00 ET

One More Session To Go …
The DJIA confirmed its third close below its 200DSMA on Thursday. The final day of the quarter beckons after which, I am a retired and happy puppy. Henceforth, whatever happens hereon into October and beyond will be entirely on you as I, the author of the DMA, will be putting this to bed after almost two decades. Happy Hunting!