Tuesday 26 September 2023 AMC
Interest rate angst paints tape in red
The major indices all fell more than 1.0% today, erasing yesterday’s modest rebound right out of the gate. The negative bias was due in part to ongoing worries about higher interest rates.
The 10-yr note yield climbed another single basis point today to 4.56%, after hitting 4.48% at this morning’s low, despite some weaker than expected new home sales and consumer confidence data released this morning. The 2-yr note yield fell five basis points to 5.04%.
Concerns about higher rates were stoked by JPMorgan Chase CEO, Jamie Dimon, who told the Times of India that he is not sure the world is prepared for 7%, and Minneapolis Fed President Kashkari (FOMC voter), who said, according to Bloomberg, that he thinks another rate hike before year end would likely be needed if the economy is stronger than expected.
Seasonality was cited as another potential factor contributing to the negative price action. September, historically, has been the worst month of the year for the S&P 500. With today’s losses, the S&P 500, Nasdaq Composite, and Russell 2000 are now down 5.2%, 6.9%, and 7.2%, respectively, this month.
Mega caps and semiconductor stocks paced broad based losses, but it was the rate-sensitive utilities sector (-3.1%) that saw the biggest decline today. The Vanguard Mega Cap Growth ETF (MGK) fell 1.7% and the PHLX Semiconductor Index fell 1.8%. The market-cap weighted S&P 500, which fell 1.5%, closed below 4,300 for the first time since early June and near its worst level of the day.
Decliners had a nearly 6-to-1 lead over advancers at the NYSE and a greater than 2-to-1 lead at the Nasdaq. Volume picked up from yesterday, but remained below average at the NYSE and Nasdaq.
All 11 S&P 500 sectors closed in the red. The energy sector (-0.5%) saw the smallest decline as oil prices climbed ($90.49/bbl, +0.87, +1.0%). The consumer discretionary sector (-2.0%) was another laggard of note along with the information technology (-1.8%) and real estate (-1.8%) sectors.
Separately, Amazon. com (AMZN) was an individual standout of note to the downside following news that the FTC and 17 state attorneys general are suing the company for illegally maintaining monopoly power.
- Nasdaq Composite: +24.8% YTD
- S&P 500: +11.3% YTD
- S&P Midcap 400: +1.7% YTD
- Dow Jones Industrial Average: +1.4% YTD
- Russell 2000: UNCH YTD

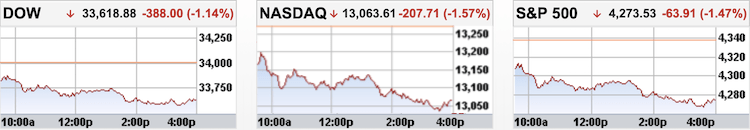
In regular trading on Tuesday, the Dow fell 1.14%, the S&P 500 dropped 1.47% and the Nasdaq Composite tumbled 1.57%, with all 11 S&P sectors finishing lower led to the downside by utilities, consumer discretionary and real estate. Notable declines were seen in mega-cap technology names such as Tesla (-1.2%), Apple (-2.3%), Amazon (-4%), Microsoft (-1.7%) and Alphabet (-1.9%). Those losses came after latest data on consumer confidence and new home sales showed the US economy may be finally coming under stress. Investors also fretted about the prospect that interest rates will remain elevated for an extended period.
- DOW closed lower at 33619 (-1.14%)
- NASDAQ closed lower at 13064 (-1.57%)
- S&P 500 closed lower at 4274 (-1.47%)
- Lower than average volume
- NYSE 848 mln vs avg. of 905 mln
- NASDAQ 4,720 mln vs avg. of 4,873 mln
- Advancing/declining volume
- NYSE 87 mln/756 mln
- NASDAQ 1,592 mln/3,071 mln
- Decliners led advancers
- NYSE 452/2,483
- NASDAQ 1,396/2,992
- Lower than average volume
Tuesday 26 September 2023 After-hours Action
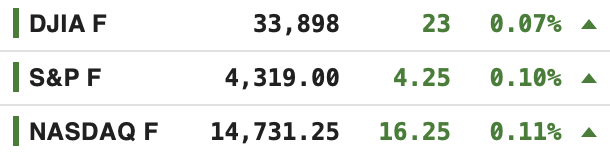
US stock futures steadied on Wednesday after Wall Street suffered another day of heavy selling. Markets now look ahead to August’s durable goods orders on Wednesday, as well as earnings reports from firms including Micron Technology, Paychex and Jefferies Financial.
Longer Tenors Give Back Early Gains
U.S. Treasuries ended Tuesday on a lower note after a slow daylong reversal off opening highs. Treasuries notched their best levels of the day at the open after a night that was quiet on the economic data front. The news flow was a bit more active, with more negative headlines about developers in China and growing speculation about more stimulus spending in Japan. The 5-yr note and longer tenors opened the day with solid gains while shorter tenors underperformed. However, the entire complex faced early pressure, which kept longer tenors on the defensive into the afternoon while shorter tenors spent the bulk of the day near their flat lines. Today’s selling lifted yields on 10s and 30s to fresh highs for the year while yields on shorter tenors are not far from doing the same. Economic data released today showed weaker than expected New Home Sales (actual 675,000; consensus 695,000) and a decrease in the Consumer Confidence Index for September (actual 103.0; consensus 105.0; prior 108.7). The U.S. Treasury sold $48 bln in 2-yr notes to strong demand ahead of tomorrow’s $49 bln 5-yr note auction.
-
Bond Yields after the close on Tuesday 26 September:
- 3-mth: unchanged at 5.58%
- 2-yr: -5 bps to 5.04%
- 5-yr: unchanged at 4.62%
- 10-yr: +1 bps to 4.56%
- 30-yr: +3 bps to 4.70%
The yield curve pivoted on the 5-year maturity yield with the long-term maturity yields rising while the 2- year maturity yield fell.
The inverted 2-year/10-year yield spread narrowed to -48 bps from -54 bps the previous session.
- The current inversion of the 2/10 which began on Tuesday 5 July 2022 is now three-hundred and ten sessions old, making it the longest period of inversion in 42 years.
- The current inverted 2y/10y spread at -107 bps, printed on Wednesday 08 March 2023, surpassed the previous widest spread printed on Tuesday 07 March 2023 at -103 bps.
- One needs to go back all the way to October 1981 to see a steeper inversion than the current one.
The inverted 3-month/10-year yield spread narrowed to -102 bps from -103 bps the previous session.
- The inverted 3m/10y spread that began on 25 October, is now two hundred and thirty-one sessions old, making it the longest inversion in 42 years.
- –189 bps printed on Thursday 01 June and Thursday 04 May is the widest inverted spread on the 3m/10y, surpassing the -188 bps printed on Wednesday 01 June and Wednesday 03 May 2023, making it the steepest inversion in 42 years.
- -189 bps surpasses all the previous inverted 3m/10y spreads over the past 50+ years.
The inverted 10-year/Federal Funds Rate spread narrowed to -78 bps on Monday 25 September from -89 bps on Friday 22 September.
- The current 10y/FFR inversion which began on Tuesday 15 November 2022 is two hundred and fifteen sessions old.
- The -171 bps spread on Thursday 04 May 2023 surpasses the -153 bps spread printed on Wednesday 05 and Thursday 06 April 2023 as the widest of the current inversion in over 22 years.
- The current inversion has surpassed the previous two inversions;
- May 2019 to March 2020
- July 2006 to January 2008
- One needs to go back to 02 January 2001 for a deeper inversion when the 10-year/FFR was at -175 bps.
- By my estimation, the inverted 10y/FFR spread would have narrowed to -77 bps on Tuesday 26 September 2023.
![]()
Dollar Hovers At 10-Month Highs
The U.S. Dollar Index rose 0.2% to 106.23 on Tuesday, hovering at its strongest levels in ten months and tracking US Treasury yields higher, as the Federal Reserve offered a hawkish outlook on monetary policy due to persistently high inflation. The US central bank kept interest rates unchanged at its September policy meeting, but signaled another rate hike before the end of the year and fewer rate cuts than previously indicated next year. Meanwhile, Chicago Fed President Austan Goolsbee said Monday the central bank is likely getting closer to the point where it can keep rates steady, though at a higher level than the market is used to seeing. Investors now look ahead to US consumer confidence and home sales data on Tuesday for more clues on the economy. The dollar scaled multi-month highs against the euro, sterling and the yen, but continued to consolidate against the Australian and New Zealand dollars.
- Currencies Majors:
- EUR/USD: -0.2% to 1.0570
- GBP/USD: -0.4% to 1.2161
- USD/CNH: UNCH at 7.3117
- USD/JPY: +0.2% to 149.07
Oil Prices Bounce Back to Over 10-Month Highs
WTI crude futures rebounded to settle Tuesday’s session at $90.49 per barrel, hovering at its highest level since November of the previous year driven by the anticipation of larger market deficits in the fourth quarter, which outweighed concerns about the possibility of an economic recession. Oil prices have surged more than 25% since the end of June, set to achieve their largest quarterly gain since early 2022 as OPEC+ majors Saudi Arabia and Russia extended supply cuts through the year’s end. Additionally, Russia recently issued a temporary ban on fuel exports to most countries in order to stabilize its domestic market, while US oil production continued to decline. Meanwhile, the backdrop of central banks adopting a hawkish stance to combat high inflation limited price gains.
- Crude Oil futures rose $0.87 (0.97%) to $90.49/barrel
- Nat Gas $0.05 fell (-1.59%) to $2.85/MMBtu
- Gold settled today’s session down $15.70 (0.81%) at $1,918.90/oz
- Silver settled today’s session $0.17 lower (0.73%) at $23.17/oz
- Copper settled $0.02 lower (0.65%) at $3.65/lb
CRB Retreats from 1-Year Highs
The CRB Commodity Index dropped to around 320, retreating from an over one-year peaks, as the higher-for-longer interest rates stance by central bankers compounded the concerns of demand downturn. Investors also continued to assess the China’s economic health, as the country’s property sector woes offset optimism around support measures. Copper, considered a barometer for the world’s economy, fell below $3.7 per pound pressured by a strong dollar and weak industrial sentiment, while gold slid to $1905, its lowest in nearly a month. At the same time, agricultural commodities, which account for more than 40% of the index, extended their downward trend amid lower prices of cocoa, soybeans, and coffee. As for the energy, crude oil hovered close to $89.5, easing from the 10-month highs.
Palm Oil Futures Trade Near MYR 3,700 for 2nd Day
Malaysian palm oil futures were trading near MYR 3,700 per ton for the second session in a row, remaining marginally above their lowest level in three months of around MYR 3,670 hit last week, supported by gains in rival oils and strong export data. Shipments of Malaysian palm oil products for Sept. 1-25 rose 17.5% from the same period in August to 1.1 million tons, cargo surveyor Intertek Testing Services said. Independent inspection company AmSpec Agri Malaysia reported that exports of palm oil products grew by 15.2% to 1.09 million tons. Meantime, a worsening drying trend may emerge in October for top producer Indonesia, according to Refinitiv Commodities Research. In India, palm oil imports in August rose about 3.9% from the prior month to a 9-month high of 1.13 million. Limiting the rise was a caution ahead of manufacturing PMI data for September in China this week after August print from officials showed factory activity shrank for a fifth straight month.
![]()
Baltic Exchange Dry Index Hits 9-Month High
The Baltic Exchange’s dry bulk sea freight index was up for the third straight session on Tuesday, rising about 5% to its highest since late December at 1,694 points, bolstered by the bigger size segment. The capesize index, which tracks vessels typically transporting 150,000-tonne cargoes such as iron ore and coal, jumped 11.5% to an over four-month high of 2,394 points, its biggest daily rise since September 7th. “The increase in fixing activity in the capesize segment out of Australia gave considerable support”, shipbroker Allied wrote in a weekly note. At the same time, the panamax index, which tracks ships that usually carry coal or grain cargoes of about 60,000 to 70,000 tonnes, added 9 points to 1,694 points, while the supramax index decreased by 1.1% to 1,339 points.

• • • • •

(Economic Excerpts from Briefing.com)
New home sales slump in August under weight of high mortgage rates
New home sales declined 8.7% month-over-month in August to a seasonally adjusted annual rate of 675,000 units (consensus 695,000) from an upwardly revised 739,000 (from 714,000) in July. On a year-over-year basis, new home sales were up 5.8%.
The key takeaway from the report is that new home sales activity, which is measured on signed contracts, is being adversely impacted by high mortgage rates that have hurt affordability. New home sales in August were the lowest since March.
- The median sales price declined 2.3% yr/yr to $430,300 while the average sales price declined 3.2% to $514,000.
- New home sales month-over-month/year-over-year by region: Northeast (+6.7%/+18.5%); Midwest (-17.2%/+24.2%); South (-7.5%/-9.2%); and West (-9.4%/+44.1%).
- At the current sales pace, the supply of new homes for sale stood at 7.8 months, versus 7.0 months in July and 8.7 months in August 2022.
- The percentage of new homes sold for $399,999 or less accounted for 40% of new homes sold versus 38% in July and 39% one year ago. Homes priced between $400,000 and $749,000 accounted for 45% of new homes sold versus 52% in July. New homes priced at $750,000 or over accounted for 15% of sales in August versus 10% in July.
Consumer confidence weakens in September as prices and interest rates rise
The Conference Board’s Consumer Confidence Index dropped to 103.0 in September (consensus 105.0) from an upwardly revised 108.7 (from 106.1) in August. In the same period a year ago, the index stood at 107.8.
The key takeaway from the report is that the drop in consumer confidence was driven by consumers’ weakening expectations for future business conditions, job availability, and incomes, all of which has the potential to translate into softer spending activity.
- The Present Situation Index rose to 147.1 from 146.7.
- The Expectations Index declined to 73.7 from 83.3, sliding back below the 80.0 level that historically signals a recession within the next year.
- Year-ahead inflation expectations held steady at 5.7%.
US House Prices Rise More than Expected: FHFA
The average prices of single-family houses with mortgages guaranteed by Fannie Mae and Freddie Mac in the United States increased by 0.8% compared to the previous month in July 2023, above market expectations of 0.5 percent and following an upwardly revised 0.4% rise in June. For the nine census divisions, monthly price changes ranged from +0.1 percent in the East South Central division to +1.4 percent in the Middle Atlantic and South Atlantic divisions. Year-on-year, house prices advanced 4.6 percent, up from 3.2 percent in June. The 12-month changes ranged from +0.3 percent in the Mountain division to +8.1 percent in the New England division. “U.S. house prices continued to appreciate in July, consistent with the trend observed over the last several months.” said Dr. Nataliya Polkovnichenko, Supervisory Economist in FHFA’s Division of Research and Statistics.
US House Prices Rebound in July: Case-Shiller
The S&P CoreLogic Case-Shiller 20-city home price index in the US edged up 0.1% yoy in July 2023, the first increase in five months, compared to forecasts of a 0.3% fall. Chicago (4.4%), Cleveland (4%), and NY (3.8%) reported the highest gains for a 3rd month. On the other hand, Las Vegas (-7.2%), Phoenix (-6.6%) and San Francisco (-6.2%) recorded the biggest declines. Compared to the previous month, house prices were 0.6% higher, after a 0.9% rise in June. House price growth peaked in 2022 and slowed sharply this year, amid base effects, increases in mortgage rates and general economic weakness. However, the national housing index has risen 5.3% so far in 2023, well above the median increase in more than 35 years. “Although the market’s gains could be truncated by increases in mortgage rates or by general economic weakness, the breadth and strength of this month’s report are consistent with an optimistic view of future results”, Craig Lazzara, Managing Director at S&P DJI said.
US Building Permits at 10-Month High in August
Building permits in the United States rose by 6.8% to a seasonally adjusted annual rate of 1.541 million in August 2023, the highest level since October 2022 and little-changed from the preliminary estimate of 1.543 million, revised data showed. The jump in permits suggested that new construction continues to thrive, driven by a shortage of homes available in the market, despite the dampening effect of rising mortgage rates on housing demand. Notably, single-family authorizations increased by 1.9% to a rate of 948 thousand, the highest since June 2022, while approvals for the volatile multi-segment surged by 15.6% to a three-month high of 593 thousand. Across the various US regions, there were increases in permits in the South (3.2% to 837 thousand), West (9.9% to 376 thousand), Midwest (14.3% to 208 thousand), and Northeast (11.1% to 120 thousand).
FTC sues Amazon for illegally maintaining monopoly power
The Federal Trade Commission and 17 state attorneys general today sued Amazon. com alleging that the online retail and technology company is a monopolist that uses a set of interlocking anticompetitive and unfair strategies to illegally maintain its monopoly power. The FTC and its state partners say Amazon’s actions allow it to stop rivals and sellers from lowering prices, degrade quality for shoppers, overcharge sellers, stifle innovation, and prevent rivals from fairly competing against Amazon.
The complaint alleges that Amazon violates the law not because it is big, but because it engages in a course of exclusionary conduct that prevents current competitors from growing and new competitors from emerging. By stifling competition on price, product selection, quality, and by preventing its current or future rivals from attracting a critical mass of shoppers and sellers, Amazon ensures that no current or future rival can threaten its dominance. Amazon’s far-reaching schemes impact hundreds of billions of dollars in retail sales every year, touch hundreds of thousands of products sold by businesses big and small and affect over a hundred million shoppers.
The FTC and states allege Amazon’s anticompetitive conduct occurs in two markets—the online superstore market that serves shoppers and the market for online marketplace services purchased by sellers. These tactics include:
Anti-discounting measures that punish sellers and deter other online retailers from offering prices lower than Amazon, keeping prices higher for products across the internet. For example, if Amazon discovers that a seller is offering lower-priced goods elsewhere, Amazon can bury discounting sellers so far down in Amazon’s search results that they become effectively invisible.
Conditioning sellers’ ability to obtain “Prime” eligibility for their products—a virtual necessity for doing business on Amazon—on sellers using Amazon’s costly fulfillment service, which has made it substantially more expensive for sellers on Amazon to also offer their products on other platforms. This unlawful coercion has in turn limited competitors’ ability to effectively compete against Amazon.
Amazon’s illegal, exclusionary conduct makes it impossible for competitors to gain a foothold. With its amassed power across both the online superstore market and online marketplace services market, Amazon extracts enormous monopoly rents from everyone within its reach.


- Japan’s July Corporate Services Price Index 2.1% yr/yr (expected 1.8%; last 1.7%). August BoJ Core CPI 3.3% yr/yr (expected 3.2%; last 3.3%)
- South Korea’s September Consumer Confidence 99.7 (last 103.1)
- Singapore’s August Industrial Production -10.5% m/m (expected -1.7%; last 3.7%); -12.1% yr/yr (expected -3.1%; last -1.1%)
- Hong Kong’s August trade deficit $25.6 bln (last deficit of $30.0 bln). August Imports -0.3% m/m (last -7.9%) and Exports -3.7% m/m (last -9.1%)
- There was growing speculation about new stimulus in Japan aimed at reducing the impact of cost-push inflation.
- Evergrande missed an interest payment on a CNY4 bln bond and two of its former executives were arrested. Separately, developer Seazen Holdings reduced its private share placement target while Guangdong Adway Construction filed for bankruptcy.
- Eight economists surveyed by China Securities Journal expect China’s economy to grow 5.2% in Q4.
Equity indices in the Asia-Pacific region ended Tuesday on a lower note. China pulled back 0.4%, while Japan slid 1.1%. The Shanghai Composite continued to struggle as concerns surrounding the property market weighed on sentiment. In Japan, the Nikkei took back all of Monday’s gain and then some with the loss today. Semiconductors took their toll on the benchmark, with Tokyo Electron, Advantest, and Screen Holdings plummeting 2-4%.
- Japan’s Nikkei: -1.1%
- Hong Kong’s Hang Seng: -1.5%
- China’s Shanghai Composite: -0.4%
- India’s Sensex: -0.1%
- South Korea’s Kospi: -1.3%
- Australia’s ASX All Ordinaries: -0.6%
- Malaysia’s FKLCI: +0.2%
- Singapore’s STI: -0.0%

- No data of note
- EU Foreign Minister Borrell will visit China in October. Germany’s finance ministry announced that debt issuance in Q4 will be EUR31 bln below the original plan.
- European Central Bank policymaker Simkus said that he would not rush to forecast the timing of the first rate cut while policymaker Muller said that he does not see the need for additional hikes at this time.
The German DAX lost 1% to 15,251 on Tuesday, the lowest close in six months, with the software maker SAP down by nearly 3%. The benchmark Stoxx 600 fell 0.6% to an over 11-week low of 448 dragged by technology and automotive stocks, as the persisting higher for longer interest rate sentiment echoed throughout the financial markets. Investors are now eagerly awaiting key inflation data from both the Eurozone and the US, which is scheduled to be released later this week.
Equities in London reversed from early losses and closed marginally above the flatline at 7,630 on Tuesday, but broadly maintained the sharp losses from the prior session as markets continued to weigh on the impact of contagion worries in China and prolonged hawkish policy by central banks in Europe and the Fed. Banks booked sharp gains in the session, with Barclays surging 4% and Standard Chartered adding 1%. On the other hand, shares with exposure to China sank after Evergrande and Hengda both missed new bond payments and furthered concerns over the country’s systemic financial health.
- U.K.’s FTSE 100: +0.0%
- Germany’s DAX: -1.0%
- France’s CAC 40: -0.7%
- Italy’s FTSE MIB: -1.0%
- Spain’s IBEX 35: -0.2%
- STOXX Europe 600: -0.6%

• • • • •

Wednesday 26 September 2023.
The Stock Trader’s Almanac’s stats for the Benchmark Indices for Wednesday of Week 39 over a 21-year average are;
- Dow Jones (DJIA): Bullish 61.9%
- S&P 500 (SPX): Bullish 61.9%
- NASDAQ (COMP): Mildly Bearish 52.4%
![]()
The Pattern Trader™ Tools Screener stats for the Benchmark Index ETFs for Wednesday of Week 39;

- SPDR DJIA ETF Trust (DIA – 19yr Avg): Bullish 55.00%
- SPDR S&P 500 ETF Trust (SPY – 19yr Avg): Bullish 60.00%
- Invesco QQQ Trust Series I (QQQ – 13yr Avg): Bullish 57.14%
Wednesday 27 September
- Japan – Monetary Policy Meeting Minutes
- Australia – CPI y/y
- EU –
- German GfK Consumer Climate
- Eurozone M3 Money Supply y/y, Private Loans y/y
- US –
- MBA Mortgage Applications (prior 5.4%) at 7:00 ET
- August Durable Orders (prior -5.2%) at 8:30 ET
- Durable Orders ex-transportation (prior 0.5%) at 8:30 ET
- Weekly crude oil inventories (prior -2.14 mln) at 10:30 ET
- $49 bln 5-yr Treasury note auction results at 13:00 ET

Almost There …
The Nasdaq Composite Index (COMP) is less than a percentage point from Correction Territory.
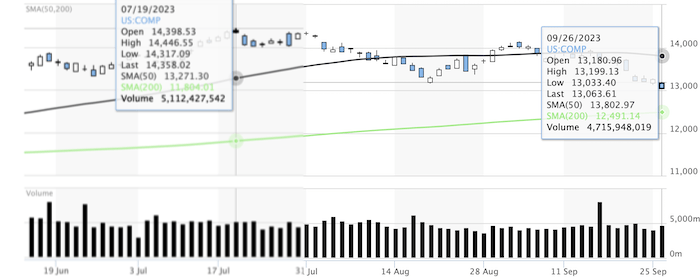
Since the high close on 19 July at 14,358.02, the tech-heavy index has made lower highs and lower lows and is now lower by -9.02% after Tuesday’s close at 13.063.61. If 13,000.00 doesn’t hold it up tomorrow, it’s adios muchachos to the mega-cap techs and hola 200DSMA.

Copyright© 2023 FinancialScents Pte Ltd
~~~~~~~~~~~~~~~~~~~~~~~~~~~~~~~~~~~~

After 17 years of educating, mentoring and supporting hundreds of participants (annually) in the arts and sciences of Finance and Economics, the Pattern Trader™ Tutorial has evolved to become the most exclusive and sought-after boutique-styled mentorship that caters to retail individuals, institutional professionals, businesses and families that are serious about their finances and their prospects as we move into the future.
Enriching, Fulfilling, Life Changing

The personal mentorship and tutorial-styled approach delivers a conducive environment that allows for close communication and interaction between the mentor and the participant. The hands-on style makes the Tutorial very practical for anyone who requires a start from the ground up. It is the perfect beginning for anyone who wishes to take that first step in improving their financial and economic literacy.
If you’re looking to make a huge difference in your financial life and get the most value for your education investment, there’s no better choice than the time-tested and well reputed Pattern Trader™ Tutorial
Download our promo slides here: The Pattern Trader™ Tutorial

~~~~~~~~~~~~~~~~~~~~~~~~~~~~~~~~
Write to support@patterntrader.com for queries and further information.