Wednesday 27 September 2023 AMC
Stocks waver amid rising rates and oil prices
Stocks were seemingly poised for a rebound in the early going following sharp losses yesterday and this month. Equities started to fade, however, as oil prices and market rates moved higher. The major indices ultimately settled off their lows thanks to a mega-cap powered climb in the afternoon trade.
Notably, the afternoon improvement happened despite yields and crude oil futures remaining elevated. The 10-yr note yield, which fell to 4.48% on no news shortly before the stock market opened, settled five basis points higher at 4.61%. The 2-yr note yield hit 5.04% overnight, but settled six basis points higher at 5.10%.
WTI crude oil futures jumped 3.8% to $93.93/bbl, which stoked lingering concerns about inflation expectations, rising gas prices, and a slowdown in consumer spending. That move helped drive a 2.5% gain in the S&P 500 energy sector.
The next best performing sector was industrials (+0.8%) followed by communication services (+0.5%) and information technology (+0.2%). The rate-sensitive utilities sector (-1.9%) saw the steepest decline.
Despite the mixed index level performance, breadth was positive this session. Advancers had a roughly 11-to-10 lead over decliners at the NYSE and the Nasdaq.
Mega caps, semiconductor stocks, and growth stocks outperformed and helped support the broader market. The Vanguard Mega Cap Growth ETF (MGK) rose 0.1% after being down nearly 1.0%, the Russell 3000 Growth Index rose 0.2%, and the PHLX Semiconductor Index rose 1.0%.
Separately, the Russell 2000 paced index level gains (+1.0%) thanks to its energy components.
- Nasdaq Composite: +25.1% YTD
- S&P 500: +11.3% YTD
- S&P Midcap 400: +2.3% YTD
- Dow Jones Industrial Average: +1.2% YTD
- Russell 2000: +1.0% YTD

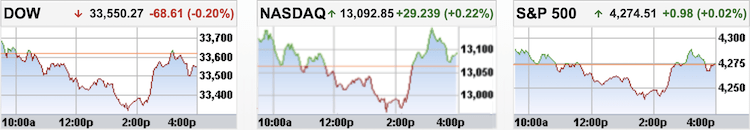
In regular trading on Wednesday, the Dow fell 0.2%, while the S&P 500 and Nasdaq Composite rose 0.02% and 0.22%, respectively. Utilities, real estate and consumer staples saw the sharpest declines, while energy, industrials and communication services outperformed the market. Those moves came as investors continued to assess the economic and interest rate outlook, with surging Treasury yields weighing heavily on equities.
- DOW closed lower at 33550 (-0.20%)
- NASDAQ closed higher at 13093 (+0.22%)
- S&P 500 closed higher at 4275 (+0.02%)
- Higher than average volume
- NYSE 922 mln vs avg. of 906 mln
- NASDAQ 4,880 mln vs avg. of 4,876 mln
- Advancing/declining volume
- NYSE 486 mln/428 mln
- NASDAQ 2,765 mln/2,066 mln
- Advancers led decliners
- NYSE 1,553/1,342
- NASDAQ 2,314/2,028
- Higher than average volume
Wednesday 27 September 2023 After-hours Action
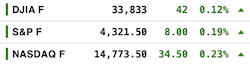
US stock futures edged higher on Thursday after the major averages ended mixed in the last session.
Opening Gains Surrendered
U.S. Treasuries retreated on Wednesday, sending yields on the 3-yr note and longer tenors to fresh closing highs for the year. The trading day started on a positive note with the long bond and the 2-yr note showing early strength, but the entire complex reversed about an hour after the start, once yields approached yesterday’s intraday lows. The reversal returned most tenors to their unchanged levels three hours after the start while the rest of the session saw continued selling in 3s and longer tenors. The pressure persisted through the afternoon even though the U.S. Treasury followed yesterday’s solid $48 bln 2-yr note sale with an even stronger $49 bln 5-yr note sale today. Today’s retreat coincided with an acceleration of yesterday’s bounce in the price of oil that sent WTI crude past $93.00/bbl to a fresh high for the year.
-
Bond Yields after the close on Wednesday 27 September:
- 3-mth: unchanged at 5.58% for a third straight session
- 2-yr: +6 bps to 5.10%
- 5-yr: +5 bps at 4.67%
- 10-yr: +5 bps to 4.71%
- 30-yr: +3 bps to 4.73%
The yield curve rose with short-term maturity yields rising more than long-term maturity yields to steepen the 2/10 inverted spread.
The inverted 2-year/10-year yield spread widened to -49 bps from -48 bps the previous session.
- The current inversion of the 2/10 which began on Tuesday 5 July 2022 is now three-hundred and eleven sessions old, making it the longest period of inversion in 42 years.
- The current inverted 2y/10y spread at -107 bps, printed on Wednesday 08 March 2023, surpassed the previous widest spread printed on Tuesday 07 March 2023 at -103 bps.
- One needs to go back all the way to October 1981 to see a steeper inversion than the current one.
The inverted 3-month/10-year yield spread narrowed to -97 bps from -102 bps the previous session.
- The inverted 3m/10y spread that began on 25 October, is now two hundred and thirty-two sessions old, making it the longest inversion in 42 years.
- –189 bps printed on Thursday 01 June and Thursday 04 May is the widest inverted spread on the 3m/10y, surpassing the -188 bps printed on Wednesday 01 June and Wednesday 03 May 2023, making it the steepest inversion in 42 years.
- -189 bps surpasses all the previous inverted 3m/10y spreads over the past 50+ years.
The inverted 10-year/Federal Funds Rate spread narrowed to -77 bps on Tuesday 26 September from -78 bps on Monday 25 September.
- The current 10y/FFR inversion which began on Tuesday 15 November 2022 is two hundred and sixteen sessions old.
- The -171 bps spread on Thursday 04 May 2023 surpasses the -153 bps spread printed on Wednesday 05 and Thursday 06 April 2023 as the widest of the current inversion in over 22 years.
- The current inversion has surpassed the previous two inversions;
- May 2019 to March 2020
- July 2006 to January 2008
- One needs to go back to 02 January 2001 for a deeper inversion when the 10-year/FFR was at -175 bps.
- By my estimation, the inverted 10y/FFR spread would have narrowed to -72 bps on Wednesday 27 September 2023.
![]()
The U.S. Dollar Index rose 0.4% to 106.70.
- Currencies Majors:
- EUR/USD: -0.5% to 1.0513
- GBP/USD: -0.1% to 1.2142
- USD/CNH: +0.2% to 7.3205
- USD/JPY: +0.4% to 149.55
Euro Touches $1.05
The Euro extended its losses towards the $1.05 mark at the end of September, reaching the weakest level since January 6th and was on track for its most significant monthly decline since May. The common currency was impacted by weaker-than-expected German consumer morale figures, as well as hawkish comments by Federal Reserve officials and strong US economic data, which boosted the dollar. Investors have also prepared for key inflation data scheduled for release later this week, with expectations that the European Central Bank will not be increasing interest rates further this year, given that concerns about an economic slowdown outweigh inflation worries. Markets are also pricing in the slight possibility of a rate cut by next June, with a rate cut nearly fully priced in by July. ECB President Lagarde stated on Monday that policymakers believe the bank’s policy rates have reached levels that would significantly contribute to achieving the inflation target.
Brent Crude Tops $96
WTI crude futures rose more than 3.5% to briefly touch $94 per barrel on Wednesday, the highest level since July of 2022 while Brent crude futures topped $96 per barrel, extending gains for a third straight session and touching fresh November-highs. The market has been grappling with tightening global supply heading into winter. The Russian government said on Wednesday it is considering restricting grey fuel exports and raising fuel export duty for resellers. It follows an export ban on exports of gasoline and diesel announced last week. Early in the month, OPEC+ majors Saudi Arabia and Russia extended supply cuts through the year’s end. Concerns about further drawdowns at the key Cushing, Oklahoma, storage hub in the US that could fall below minimum operating levels also kept markets on edge. EIA data showed crude inventories in the US fell by a much bigger-than-expected 2.17 million barrels last week, and stocks at Cushing fell for a seventh consecutive week.
- Crude Oil futures rose $3.44 (3.8%) to $93.93/barrel
- Nat Gas $0.06 rose (1.96%) to $2.91/MMBtu
- Gold settled today’s session down $28.10 (1.46%) at $1,890.80/oz
- Silver settled today’s session $0.49 lower (2.09%) at $22.69/oz
- Copper settled $0.02 lower (0.53%) at $3.63/lb
EIA petroleum data for the week ended Sep 22
- Crude oil inventories had a draw of 2.17 mln barrels
- Prior week showed a draw of 2.14 mln barrels
- Gasoline inventories had a build of 1.03 mln barrels
- Prior week showed a draw of 831K barrels
Summary of Weekly Petroleum Data for the week ending September 22, 2023
U.S. crude oil imports averaged 7.2 million barrels per day last week, increased by 711 thousand barrels per day from the previous week. Over the past four weeks, crude oil imports averaged about 7.0 million barrels per day, 8.2% more than the same four-week period last year. Total motor gasoline imports (including both finished gasoline and gasoline blending components) last week averaged 710 thousand barrels per day, and distillate fuel imports averaged 114 thousand barrels per day.
U.S. commercial crude oil inventories (excluding those in the Strategic Petroleum Reserve) decreased by 2.2 million barrels from the previous week. At 416.3 million barrels, U.S. crude oil inventories are about 4% below the five year average for this time of year. Total motor gasoline inventories increased by 1.0 million barrels from last week and are about 2% below the five year average for this time of year. Finished gasoline inventories decreased, while blending components inventories increased last week. Distillate fuel inventories increased by 0.4 million barrels last week and are about 13% below the five year average for this time of year. Propane/propylene inventories increased 0.7 million barrels from last week and are 19% above the five year average for this time of year. Total commercial petroleum inventories decreased by 1.5 million barrels last week.
Palm Oil Futures At 1-Week Peak
Malaysian palm oil futures were trading near MYR 3,750 per ton, approaching their highest level in a week, amid gains in rival oils and a weaker ringgit. Meantime, exports of Malaysian palm oil products for Sept. 1-25 rose 17.5% from the same period in August to 1.1 million tons, cargo surveyor Intertek Testing Services said. Independent inspection company AmSpec Agri Malaysia reported that exports of palm oil products grew by 15.2% to 1.09 million tons. Meantime, a worsening drying trend may come in October for top producer Indonesia, according to Refinitiv Commodities Research. In India, palm oil imports in August rose 3.9% mom to a 9-month high of 1.13 million. Limiting the rise was a caution ahead of manufacturing PMI data for September in China this week after August print from officials showed factory activity shrank for a fifth straight month. Meantime, official data showed the EU 2023/24 palm oil imports stood at 821,115 tons by Sept. 24, compared with 902,142 tons last year.
![]()
Baltic Exchange Dry Index At 11-Month High
The Baltic Exchange’s dry bulk sea freight index was up for the fourth straight session on Wednesday, rising about 3.4% to its highest since October 25th at 1,752 points, mainly supported by the bigger size segment. The capesize index, which tracks vessels typically transporting 150,000-tonne cargoes such as iron ore and coal, also advanced for the fourth session in a row, rising 7.6% to 2,576 points, thanks to the sustained robust cargo volumes in the Pacific market; and the panamax index, which tracks ships that usually carry coal or grain cargoes of about 60,000 to 70,000 tonnes, added 17 points to 1,711 points. Among smaller vessels, the supramax index decreased by 1.6% to 1,318 points.
• • • • •

(Economic Excerpts from Briefing.com)
US Mortgage Applications Fall Again as Rates Top Fresh 2000-Highs
Mortgage applications in the US declined 1.3% in the week ending September 22nd, 2023, following a 5.4% rise in the previous week which was the biggest increase since mid-June, data from the Mortgage Bankers Association data showed. Applications to refinance a home loan declined 0.9% and those to buy a home fell 1.5%, as both prospective homebuyers and homeowners continue to feel the impact of high interest rates. The average contract interest rate for 30-year fixed-rate mortgages with conforming loan balances ($726,200 or less) edged up by 10bps to 7.41%, a new high since December 2000.
30-Year Mortgage Rates in the US Hit New 23-Year High
The average contract interest rate for 30-year fixed-rate mortgages with conforming loan balances ($726,200 or less) in the US rose by 10bps to 7.41% in the week ended September 22nd 2023. It marks a third consecutive week of increases, pushing borrowing costs to fresh December 2000-highs, after a hawkish tone from the Fed led to a rise in Treasury yields. A year ago, rates were about a full percentage point lower at 6.52%. Meanwhile, the 30-year fixed jumbo mortgage rate increased to 7.34%, the highest rate in the history of the MBA’s series dating back to 2011.
Durable goods orders and business spending pickup in August
Total durable goods orders increased 0.2% month-over-month in August (consensus -0.2%) following a downwardly revised 5.6% decline (from -5.2%) in July. Excluding transportation, durable goods orders were up 0.4% (consensus 0.3%) following a downwardly revised 0.1% increase (from 0.5%) in July.
The key takeaway from the report is that orders for non-defense capital goods excluding aircraft – a proxy for business spending – were up a robust 0.9% month-over-month, rebounding from a 0.4% decline in July.
- New orders for primary metals declined 0.6% month-over-month after declining 0.1% in July.
- New orders for fabricated metal products jumped 0.5% month-over-month on the heels of a 0.7% increase in July.
- New orders for machinery rose 0.5% month-over-month after a 0.7% increase in July.
- New orders for computers and electronic products were up 0.3% month-over-month, rebounding from a 0.6% decline in July.
- New orders for transportation equipment fell 0.2% month-over-month after declining 14.8% in July, but new orders for motor vehicles and parts increased 0.3% after increasing 0.7% in July.
- Shipments of nondefense capital goods orders excluding aircraft, which factors into GDP computations, increased 0.7% month-over-month following a 0.3% decline in July.
![]()
Minneapolis Fed President Neel Kashkari (FOMC voter)
Doesn’t know if Fed is sufficiently restrictive yet with policy;
- Possible that neutral rate has moved up
- Consumer spending still robust; autos and housing starting to show signs of bottoming
- Have made a lot of progress on inflation, but still have work to do to get inflation back down to 2% target
- Fed keeping an eye on strikes and their impact on economy
- Higher oil prices will affect economy, but wouldn’t look at them definitively as basis for what inflation will do
- If Fed has to keep rates higher for longer, it is because economy has been stronger than expected; higher for longer does not mean the economy will suffer a recession
- He sees one more rate hike this year, but his SEP projection has Fed holding things steady in 2024


- China’s August Industrial Profit -11.7% YTD (last -15.5%)
- Japan’s July Leading Index -0.6% m/m (expected -1.2%; last -0.2%) and Coincident Indicator -1.4% m/m (expected -1.1%; last 0.8%)
- South Korea’s October Manufacturing BSI Index 68 (last 67)
- Australia’s August Weighted Mean CPI 5.2% yr/yr, as expected (last 4.9%)
- The People’s Bank of China injected liquidity and pledged to step up policy coordination in Q3.
- There was continued focus on Evergrande as offshore creditors joined a petition to wind up the company if there is no restructuring plan by the end of October.
- The Bank of Japan’s Minutes from the July meeting showed an agreement to continue easing and watching for continued wage growth in the coming years.
- Thailand’s central bank unexpectedly raised its policy rate by 25 bps to 2.50%.
Equity indices in the Asia-Pacific region ended the midweek session on a mostly higher note. China and Japan inched higher by 0.2%. The Shanghai Composite seemed to benefit from a deceleration in the fall of Industrial Profits in August. The year-to-date reading came in at -11.7% compared to -15.5% in July. In Japan, the Nikkei was buoyed by strength in biopharma stocks, where Eisai, Chugai Pharmaceutical Co, Sumitomo Pharma, and Daiichi Sankyo jumped 3-4%.
- Japan’s Nikkei: +0.2%
- Hong Kong’s Hang Seng: +0.8%
- China’s Shanghai Composite: +0.2%
- India’s Sensex: +0.3%
- South Korea’s Kospi: +0.1%
- Australia’s ASX All Ordinaries: -0.1%
- Malaysia’s FKLCI: -0.4%
- Singapore’s STI: -0.5%

- Eurozone’s August M3 Money Supply -1.3% yr/yr (expected -1.0%; last -0.4%), August private sector loans 1.0% yr/yr (expected 1.2%; last 1.3%) and loans to nonfinancials 0.6% (last 2.2%)
- Germany’s October GfK Consumer Climate -26.5 (expected -26.0; last -25.6)
- France’s September Consumer Confidence 83 (expected 84; last 85)
- Swiss September ZEW Expectations -27.6 (last -38.6)
- Eurozone’s M3 Money Supply decreased at its fastest pace on record in the August reading.
- Norway’s Equinor received approval from British regulators to develop an oil and gas project in the North Sea.
- European Central Bank policymaker Elderson said that rates have not peaked yet and there is still a lot of uncertainty.
Equity markets in Europe fell further in afternoon trade, with Germany’s DAX dropping 0.3% to close at a six-month low of 15,217. The pan-European STOXX 600 also dropped to its lowest since March, as concerns regarding the potential for extended periods of elevated interest rates and China’s slowing economic growth mounted. Turning to economic data, Germany saw a more significant weakening of consumer sentiment than initially anticipated as October approached, as the propensity to save hit its highest level since April 2011 due to persistently high inflation. Additionally, confidence among consumers in France and Sweden also deteriorated throughout September. Insurance providers were among the sharpest laggards on the corporate front and closed nearly 2% lower, setting the pace for softer losses among banks. On the other hand, energy producers benefited from another session of rises for crude oil benchmarks.
Equities in London lost ground to close about 0.4% down at 7,493 on Wednesday, its lowest since September 8th, as traders remained focused on the prospect of a prolonged period of elevated interest rates while rising energy prices reignited concerns about spiking inflation. Locally, traders were monitoring news that the government approved the UK’s largest untapped oil field, Rosebank, despite warnings about the climate damage of new fossil fuel projects.
- U.K.’s FTSE 100: -0.4%
- Germany’s DAX: -0.3%
- France’s CAC 40: -0.0%
- Italy’s FTSE MIB: -0.3%
- Spain’s IBEX 35: -0.4%
- STOXX Europe 600: -0.2%
• • • • •

Thursday 28 September 2023.
The Stock Trader’s Almanac’s stats for the Benchmark Indices for Thursday of Week 39 over a 21-year average are;
- Dow Jones (DJIA): Bullish 57.1%
- S&P 500 (SPX): Bullish 57.1%
- NASDAQ (COMP): Bearish 61.9%
![]()
The Pattern Trader™ Tools Screener stats for the Benchmark Index ETFs for Thursday of Week 39;
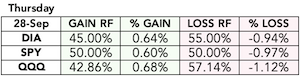
- SPDR DJIA ETF Trust (DIA – 19yr Avg): Bearish 55.00%
- SPDR S&P 500 ETF Trust (SPY – 19yr Avg): Flat-to-Bearish 61.9%
- Invesco QQQ Trust Series I (QQQ – 13yr Avg): Bearish 57.14%
Thursday 28 September
- Australia – Retail Sales m/m
- UK – Nationwide HPI m/m
- EU –
- ECB Economic Bulletin
- German Prelim CPI m/m
- Spanish Flash CPI y/y
- US –
- Q2 GDP – third estimate (prior 2.1%) at 8:30 ET
- Q2 GDP Deflator – third estimate (prior 2.0%) at 8:30 ET
- Weekly Initial Claims (prior 201,000) at 8:30 ET
- Continuing Claims (prior 1.662 mln) at 8:30 ET
- August Pending Home Sales (prior 0.9%) at 10:00 ET
- Weekly natural gas inventories (prior +64 bcf) at 10:30 ET
- $37 bln 7-yr Treasury note auction results at 13:00 ET

Rates are rising, but rate-hike expectations are not
~ Briefing.com ~
A week ago, the FOMC voted unanimously to leave the target range for the fed funds rate unchanged at 5.25-5.50%. Its Summary of Economic Projections, however, implied there was likely to be one more rate hike before the end of the year and perhaps only two rate cuts in 2024.
There is a lot of attention – deservedly so – on the rise in the 10-yr note yield today to 4.59%. Just don’t blame rate-hike expectations for that move. We say that for a few reasons:
- First, the Fed doesn’t control long-term rates.
- Secondly, the CME FedWatch Tool shows a 25.6% probability of a 25 basis points rate hike at the November meeting versus (and this is the key thing) a 28.9% probability a week ago.
There are other factors presumably driving the jump in the 10-yr note yield:
- WTI crude futures up 3.8% to $93.82/bbl, stirring worries about rising inflation expectations.
- The U.S. government looks like it is headed for a shutdown, and the dysfunction in Congress is feeding worries about Moody’s perhaps joining S&P and Fitch Ratings in downgrading the U.S. credit rating.
- Growing attention is being paid to the budget deficit and the increased supply needed to fund the deficit.
- The yen and the yuan continue to weaken against the dollar, which is fostering a belief that any looming defense of those currencies will entail selling Treasuries.
- The Fed is continuing with its quantitative tightening activity.
- Technical momentum continues in favour of sellers.

Two More Sessions To Go
The bulls really didn’t grab the market by the collar or bully its way back into the game – rather, it was like the bears sat back and watched what the bulls could do in their absence. The result; Not much … at least not enough to impress or convince me that the last two sessions will bounce back.