A note from the Author

I started drafting this October MMO weeks ago before I decided to call it quits in the last week of September. Since it was more than halfway done, I decided to finish it up and post it as my swan song from the DMA, WMO and MMO series after 18 years of writing these reports.
Within less than a year from now, all my websites will be coming down as I will not be renewing the hosting for these sites as they expire. All the data will be gone forever and I will be starting a new chapter in my life. I hope that you’ve found my postings educational and entertaining through the almost-two-decades of writing this stuff. So for the final time …

Time To Go Shopping … Or Time To Panic?
OCTOBER has been a good time to pick up bargains especially if September had fulfilled its reputation for being the most bearish month of the year. However, there are those who quietly harbour a fear for the 10th month as a result of its infamous history for crashing and/or starting major downturns.
The fact is October has been more bullish than bearish over 5, 10, 15, 20 and 25 year averages. You can even go as far back as the early 1900’s and you’ll still discover that October isn’t and has never been a bearish month in normal circumstances. It is undeniable that the month has been responsible for the worst market crashes in history amongst all the other months. But look past those few extraordinary dates and you’ll find a month so bullish it can rival the likes of April, July, November and December. And that’s only scratching the surface of the major indices.
When you get down to the sector indices and ETFs, October gets even tastier …
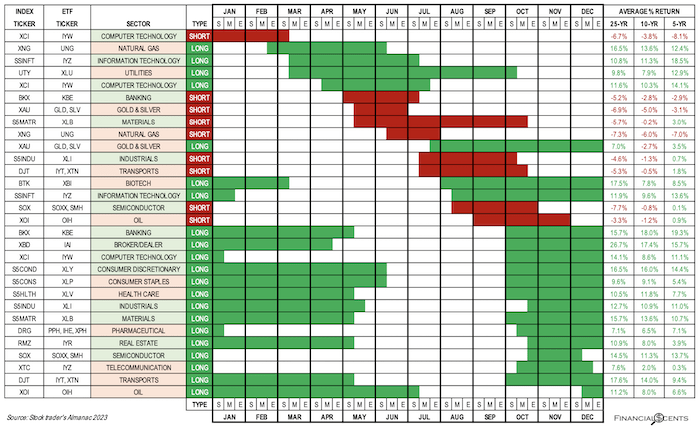
Click to view the pdf.
2023 has been, thus far, a normal year in that the market is trending as it usually does. Seasonal patterns haven’t skewed far from its historical statistics and the threat of a recession in the US seems to have faded along with global forex reserves (okay, that was a bad joke 😬). So if normalcy prevails, you’ll have one helluva long shopping list to go through if you’re planning on taking positions in October. Okay … that was also a bad pun. 🤭
We’re going to carefully analyse the market and the macroeconomics behind it to see if it’s going into a month of opportunity or another infamous crash.

From September’s MMO;
“This past week (35) saw volumes fall off a cliff as the market made its relief rally – not an encouraging sign for the bulls as all – in what is likely to be unsustainable and most likely to top out again in September. Should that happen, it’s going to be a grand Double Top across all the four benchmark indices.“
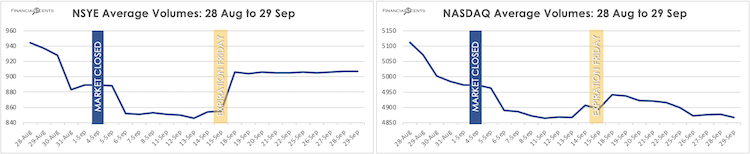
Since that quote from a month ago, volumes across both exchanges haven’t improved with any significance. Such is the nature of August and September, which makes October a threat in any direction as the continued weak volumes make for easy and volatile gyrations.
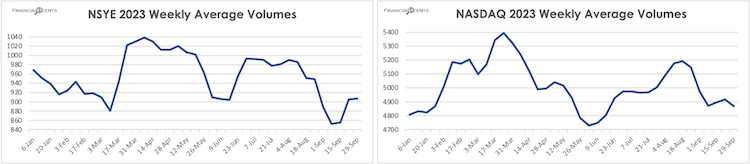
Average volumes on both NYSE and NASDAQ are currently on the lower end of the yearly average and lower than last year’s average low.
September 2023 Fulfils Its Bearish Reputation
In last month’s MMO, it was mentioned;
“… the bulls reappeared to rally the market up between 24 to 31 August on significantly lower average volumes and a general lack to continuity and/or sustainability as most of the buying was done on the speculation that the Fed may reconsider its tightening program based on “some” of the latest economic data. I reckon a lot of the buying were bargain hunters and dip buying “investors” out of FOMO and a basic lack of awareness regarding market and economic conditions.“
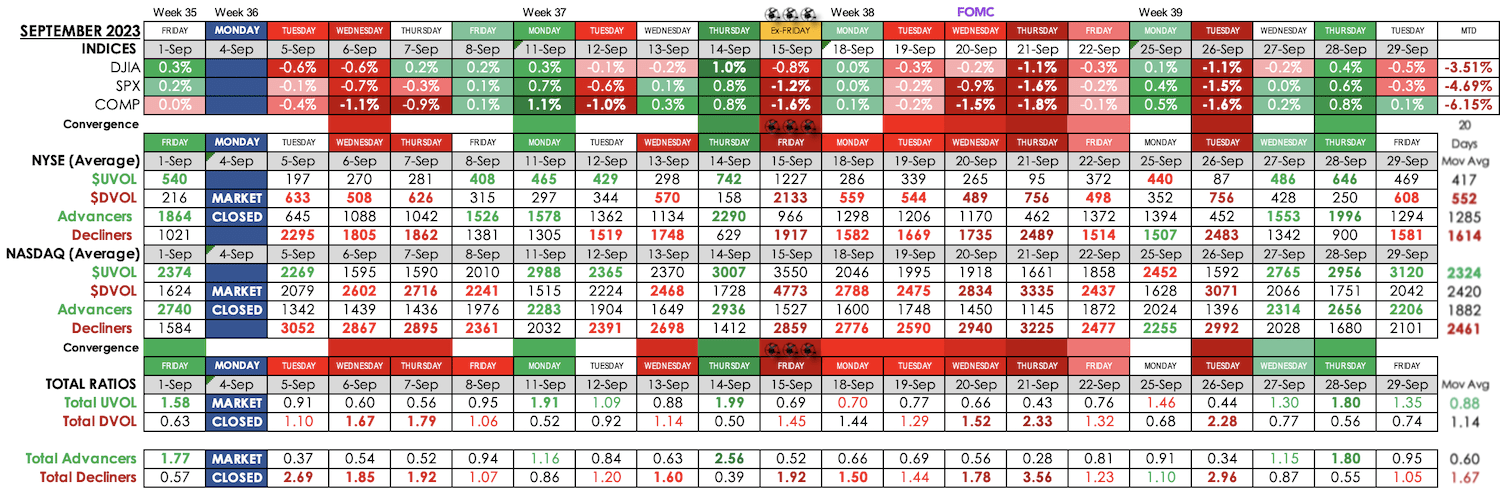
Click to expand
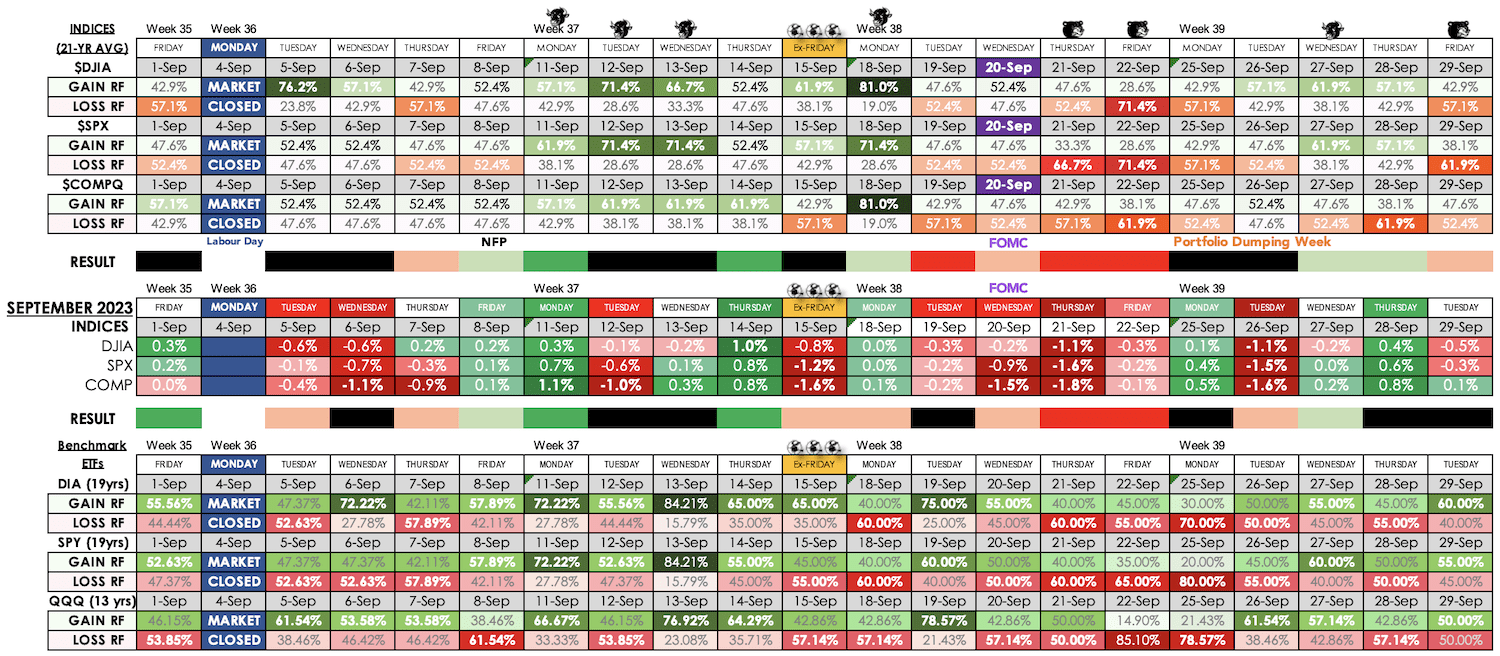
The bears certainly left their mark on September this year and with rather impressive numbers too. Seven totally bearish convergent sessions made for a third of the month’s performance but the more impressive numbers were in the market internals where ten sessions were absolutely bearish with DVOLs outpacing UVOLS and Decliners outpacing Advancers. There were only three bullish convergent sessions that hardly made a dent on the month’s proceedings.
Energy Leadership Is NOT Bullish
From last month’s MMO;
“Real, sustainable leadership is still an enigma in the market right now. Historically, the market tends to get extremely volatile (bearish) or extremely flat after a sustained period without leadership from the likes of Industrials, Financials, HomeBuilders, Consumer Discretionary, Transports and/or Retail. With September beckoning, it’s going to be very tricky for this market to navigate any sort of sustainable bounce without leadership from one or several of the aforementioned sectors.“
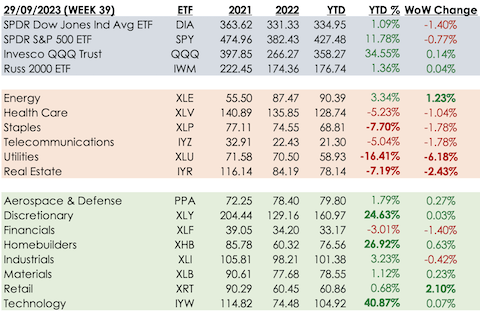
Week 39 finished with the defensive sectors losing out the most … except for the Energy sector. Outside of Technology, Homebuilders and Discretionary who have been the best YTD gainers for twenty-seven straight weeks, Energy have now established themselves as the fourth-best sector having gone from being one of the worst losers earlier in the year. Energy’s leadership often equates to high inflation – something that the market seriously dreads now as expectations of peak interest rates seem to be fading after a couple of months of optimism that rate cuts were around the corner.
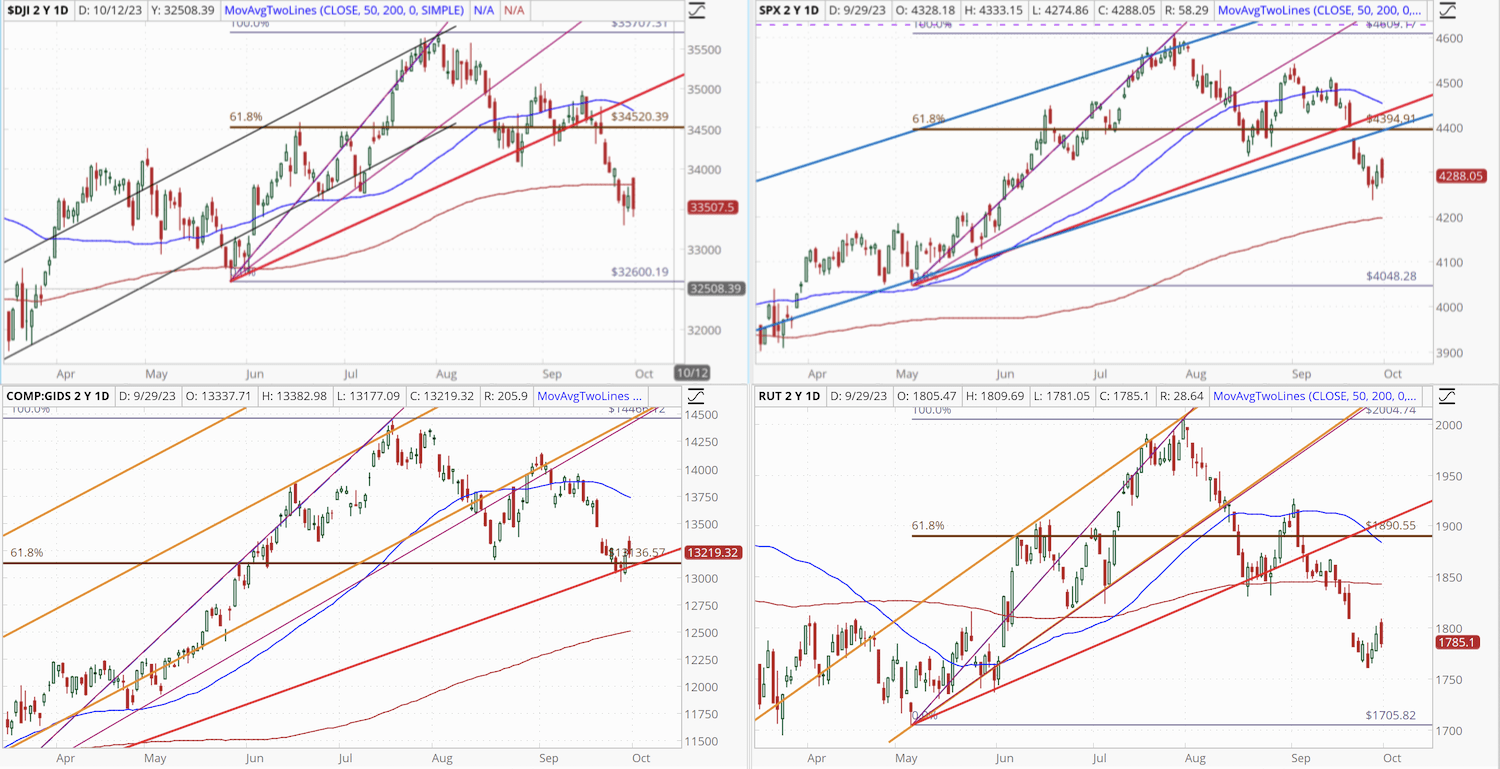
Technically Speaking …
Click to expand
Last month …
“I’m seeing some MACD Divergence as the current high price is lower than the previous high price while the current histograms are higher than the histograms of the previous high price around 17 July”
September saw the benchmarks print lower lows after lower highs with all four trending below their 50DSMAs. DJIA and RUT closed the month below their 200DSMA to mark a technically bear market. COMP is not far behind from approaching its own 200DSMA while SPX languishes in no-man’s-land between its 50 and 200 DSMAs.
DJIA, SPX and RUT have fallen out of and below their respective PhiB-Fans while COMP is barely keeping its head above its own PhiB-Fan support and COP (61.8%) level.
Having seemingly completed two waves to the downside, the benchmarks just might look to recover in October. This could well happen if the macroeconomic environment doesn’t spring anymore overly-optimistic numbers to give the Fed more reasons to keep raising rates. Having said that, those numbers should also not be too pessimistic as investors are always extremely nervous in October. With low volumes and the lack of proper sector leadership, it won’t take much to send the market either way. It all comes down to the numbers.
About that P2P Divergence …
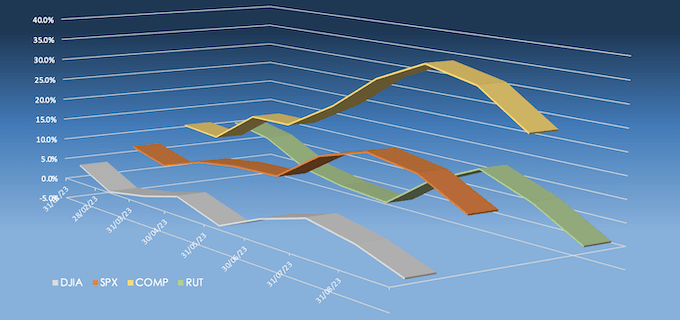
At the end of September, the price-to-price divergence between the benchmarks is extremely obvious. The Nasdaq Composite is outpacing the S&P 500 by two-and-a-half times while the S&P 500 is outpacing the Dow Jones Industrial Average by ten times. Those multiples have been consistently increasing through the months since the start of the year. If not for the corrections in August and September, those multiples would be higher. Regardless, the P2P divergence now is still ridiculous.
- Dow Jones Industrial Average: -3.8% for the month / +1.1% YTD
- S&P 500: -5.0% for the month / +11.7% YTD
- Nasdaq Composite: -5.8% for the month / +26.3% YTD
- Russell 2000: -7.1% for the month / +1.4% YTD
IYC Flattening To The Upside …
U.S. Treasury Yields climbed off their lows of the day on the final day of trading in September with the 10-yr note yield settling unchanged from Thursday at 4.59%, but it hit 4.52% earlier in the session on Friday. The 2-yr note yield fell a single basis point to 5.03% after falling to 5.02%.
- Bond Yields after the close on Friday 29 September:
- 3-mth: -1 bp to 5.55% (-1 bps for the month)
- 2-yr: -1 bp to 5.03% (+18 bps for the month)
- 5-yr: -2 bps at 4.60% (+37 bps for the month)
- 10-yr: unchanged at 4.59% (+50 bps for the month)
- 30-yr: +2 bps to 4.73% (+53 bps for the month)
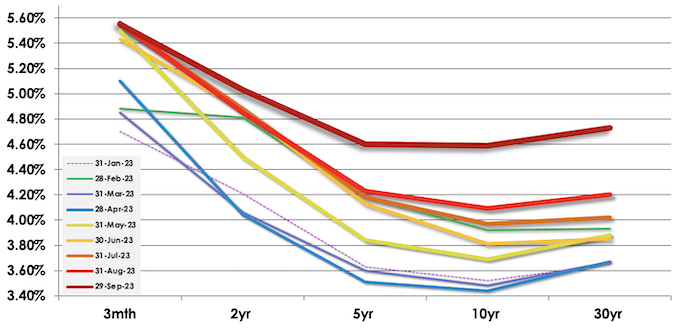
The yield curve is at its highest in over a year and has been pivoting upwards with its long-term maturity yields rising more than its short-term maturity yields, with the 3-month maturity yield acting as the pivot point.
At the close of September;
- The current 2-year/10-year inversion which began on Tuesday 5 July 2022 is now three-hundred and thirteen sessions old, making it the longest period of inversion in 42 years.
- The inverted 3-month/10-year spread that began on 25 October, is now two hundred and thirty-four sessions old, making it the longest inversion in 42 years.
- The current 10-year/Fed Funds Rate inversion which began on Tuesday 15 November 2022 is two hundred and eighteen sessions old.
The inversions have been narrowing as the yield curve pivots upwards against the short-term maturity yields. This is actually quite a normal phenomenon that precedes the yield curve “normalising” and un-inverting itself – once the long-term maturity yields have risen sufficiently, the short-term maturity yields usually experience a drop as investors make a late dash for the high yields. The massive flight to quality in short-term yields will send those bond prices up, and in that process, pull yields down lower than its long-term counterparts.
The question is how long more can this inverted yield curve stay up and inverted before it normalises?
On average over the last few decades, an inversion of any permutation has lasted about 10 months or 150-to-180 sessions. On the extreme end of the average, an IYC can go on for 21 months as was the case in the 1970s. That works out to around 350 sessions.
The rest is for you to work out and guesstimate. At the end of it, an economic downturn or recession awaits … every time.
Historical stats were better in September than in August
Click to expand
Out of the 20 sessions in September, only eight were totally divergent from the historical statistics from the Stock Trader’s Almanac’s 21-year averages on the benchmark indices. Against our Stock Screener, only seven sessions were totally divergent from the index ETFs’ performance.
• • • • •

OUTLOOK FOR OCTOBER 2023

OCTOBER is historically infamous for the worst market crashes in stock market history. The Stock Trader’s Almanac ranks it 7th of out 12 months on the DJIA, SPX and COMP while ranking 11th and 8th on RUT and RUI respectively. It is also the start of the final earnings season for Q3’s performance, beginning in Week 41 with the results from WBA, JPM and UNH.
OCTOBER TRIVIA
- October is the first month of Quarter Four.
- The month of October 2023 has 22 trading sessions and one Bond Market holiday, making it the joint-second longest trading month of the year along with May and behind March and August with 23 session each.
- It is DOW’s and S&P’s final month of its “volatile six months” of the year and NASDAQ’s final “worst four months”.
- Monday 09 October 2023 – Bond Market Closed in observance of Columbus Day.
Volumes are usually at their weakest in October after falling off in August and September in anticipation of September’s bearish reputation and the “October Effect”. The “October Effect” is a historical reminder of what the month has done, in the past, to markets that were overbought, bubbled and/or troubled;
- The Bank Panic of 1907
- The Stock Market Crash of 1929
- Black Thursday – October 24, 1929 (-11.0%)
- Black Monday – October 28, 1929 (-12.8%)
- Black Tuesday – October 29, 1929 (-11.7%)
- October, 1978 (Down more than 10% in 2 weeks)
- Great Crash of 1979 – October 14, 1979 (-8.3%)
- Black Monday – October 19, 1987 (-22.6%)
- Friday the 13th, 1989 (-6.9%)
- “Mini Crash” of October 27, 1997 (-7.2%)
- Sub-Prime Crash – September to October 2008
In recent years since the Sub-Prime Crash, October usually begins with wild swings in the first week then becomes bullish by the second week and more bullish by the third week. The month then gets rather flat in the final week.
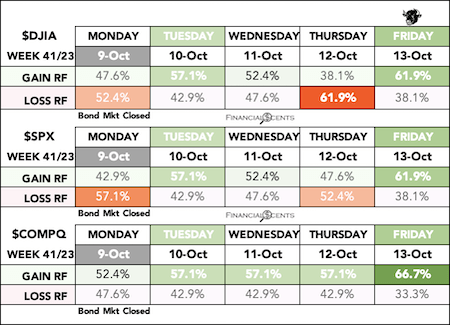
Based on a 21-year average on the Benchmark Indices (DJIA, SPX & COMP) according to the Stock Trader’s Almanac;
Click to expand
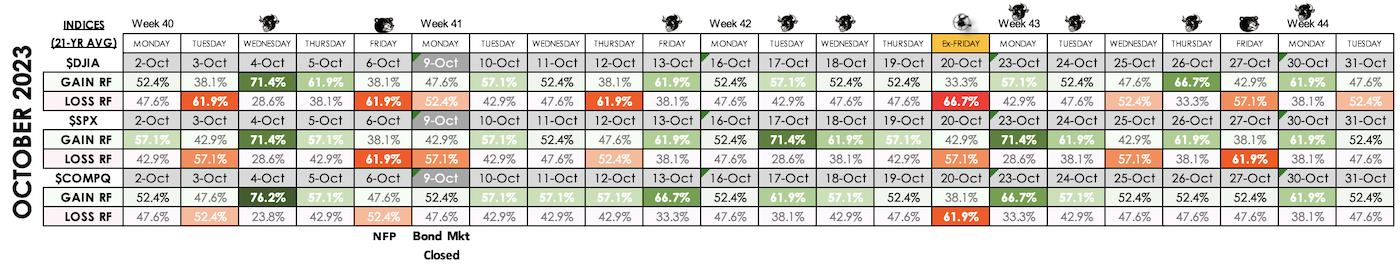
- Week 40 (02 to 06 October) usually starts flat, becomes bearish then turns bullish mid-week and ends poorly.
- Week 41 (09 to 13 October) is flat with mild bullish swings.
- Week 42 (16 to 20 October) has been mostly bullish but ends bearish on Expiration Friday.
- Week 43 (23 to 27 October) begins bullish but becomes prone to wild swings midweek onwards.
- Week 44 (30 October to 03 November) is mostly bullish.
Some interesting statistics for October 2023;
October plays host to one of the joint-seventh most bullish sessions in the year has been more bullish than bearish over the last 22 years. Oddly enough, in spite of its reputation (and documented data) for crashes, October holds no records for bearish sessions.
- First trading day in October (Monday 02) has been down on the DJIA 9 of the last 17 (last year up).
- The first week of October tends to swing up and down.
- Wednesday 04 October is amongst the seventh most bullish sessions of the year.
- Monday 09 October – Bond Market Closed in observance of Columbus Day.
- The second week of October tends to be more bullish than bearish.
- Q4’s Earnings Season for Q3’s results officially begins this week.
- Monday of October Expiration Week has been up on DJIA 30 of the last 40 (last year up).
- The third week of October is the month’s most bullish week but it ends poorly on Expiration Friday.
- Thursday October 19 is the anniversary of the Crash of 1987 – DJIA down 22.6% in one session.
- October Expiration Friday has been up on DJIA 7 of the last 9 (last year up).
- The week after October Expiration Week (Week 43) is prone to wild swings.
- The second-last day in October tends to be bullish (last year up).
In the last two years …
The tables below are how October performed in the last two years;
Click to expand
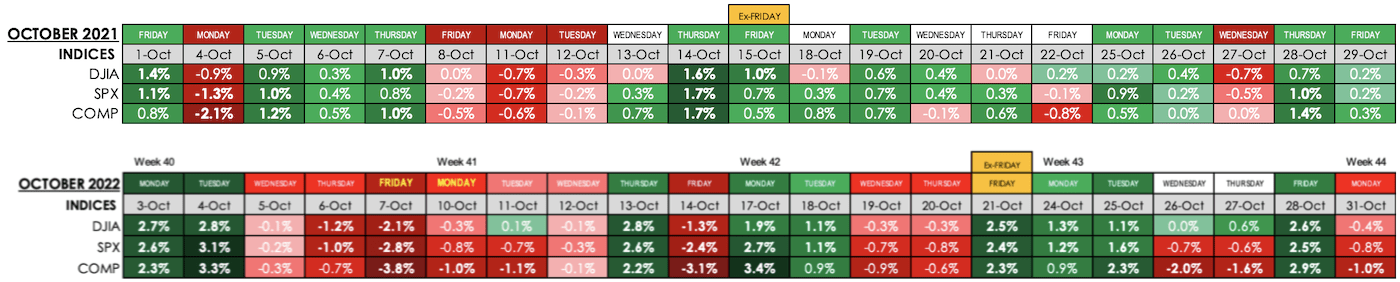
It is interesting to note that 2021 was a bullish year but the gains in October that year were miserly;
- DJIA +6.2% MTD
- SPX +7.0% MTD
- COMP +6.5% MTD
Compare those 2021 returns with the returns from a bearish 2022;
- DJIA +13.3% MTD
- SPX +8.0% MTD
- COMP +4.3% MTD
As previously mentioned, in recent years, the month of October hasn’t been as bearish as conventional wisdom would suggest. Seven of the last ten Octobers have been bullish with only 2016, 2018 and 2020 going down … and not by market crashing standards at all.


OCTOBER is the first month of the fourth quarter and the last month of “The Six Volatile Months” on the S&P 500 and Dow Jones Industrial Average. The month of October has seen the most market crashes in history including almost all of the famous “black” days, as listed in the “Coming Month” section above. However, October has seen more starts to bull runs than it has seen crashes, so much so the month is also known as a “Bear-Killer Month” (See “Education” in the next section).
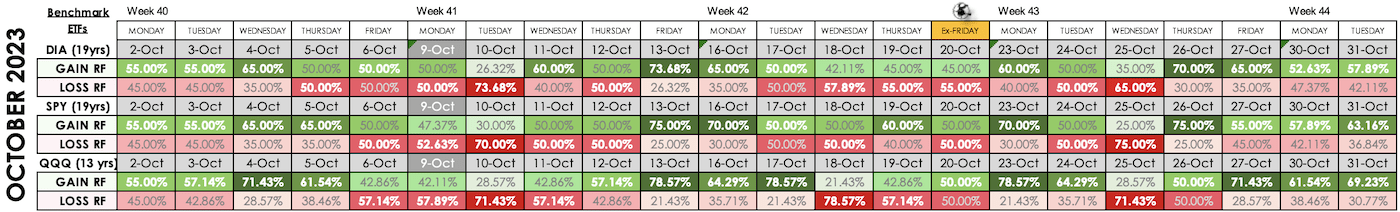
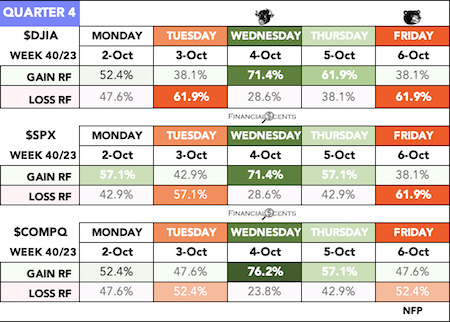
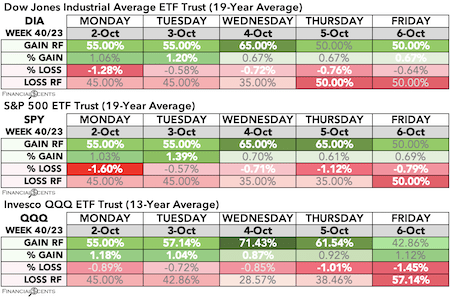
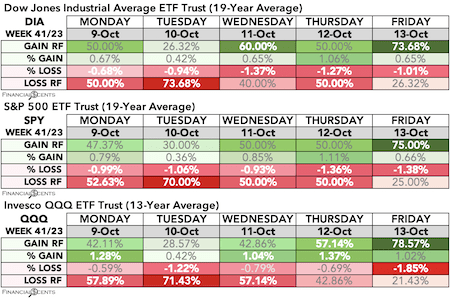
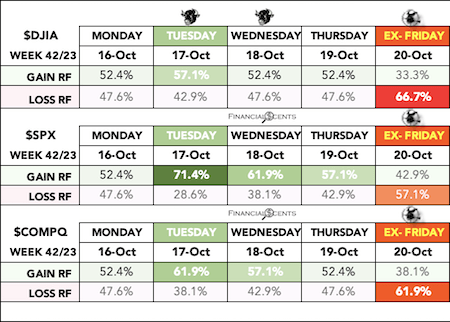
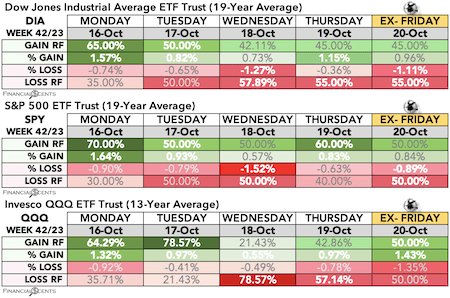
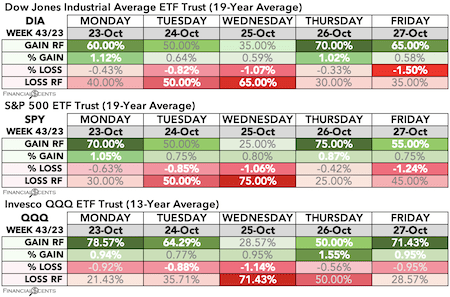
This is the Daily October Table from our Seasonal Screener for the benchmark indices’ ETFs, DIA, SPY and QQQ.
Click to expand
- Week 40 (02 to 06 October) usually starts bullish then ends mildly bearish.
- Week 41 (09 to 13 October) is mostly bearish and ends very bullish.
- Week 42 (16 to 20 October) starts bullish then turns bearish midweek for the rest of the week.
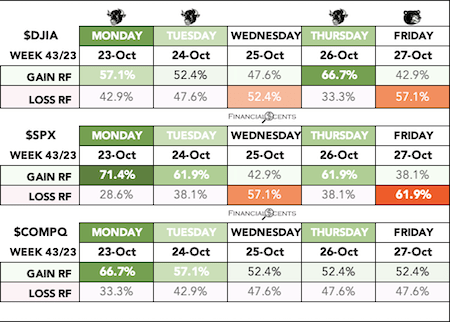
- Week 43 (23 to 27 October) starts bullish, becomes bearish midweek and ends bullish.
- Week 44 (30 October to 03 November) is is bullish all the way.
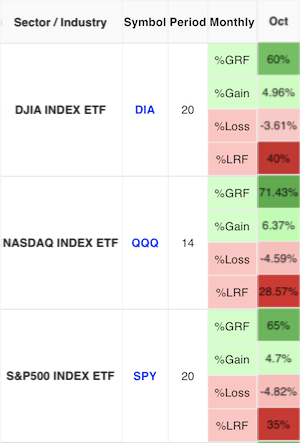 Unlike the stats from the Stock Trader’s Almanac, our Seasonal Screener reveals that the index ETFs for the benchmarks in October are not as bullish. The ETFs tend to get more bearish than bullish in the second and third weeks of the month and gets more bearish in the final week.
For October over the last 20 years, DIA carries a 60.00%GRF/40.00%LRF with an average +4.96%Gain and lower risk at -3.61%Loss. October’s %GRF for DIA is the best offering for the year.
October is QQQ’s third-best month, offering an impressive 71.43%GRF/28.57%LRF over its last 14 years. It comes with a higher average gain of +6.37% than its downside potential of -4.59%. October is the tech-heavy ETF’s second-best month for bullish gains after March but also the third-highest %LRF after July (-7.55%LRF) and January (-4.79%LRF).
SPY is also considerably bullish at 65.00%GRF/35.00%LRF over its last 20 years for an average gain of +4.70% while carrying a slightly higher average loss of -4.82%. October is SPY’s best %GRF offering for the year but it is also the second-highest risk %LRF after May and September, both at -4.89%LRF.
 Get the daily statistics with our Daily Market Analysis posted here everyday.
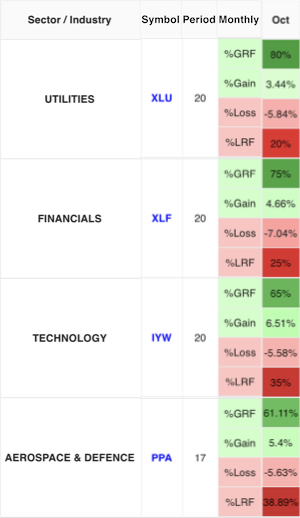
October has twelve of the thirteen ETFs featured in our free Seasonal Screener with %GRFs above 55%, making it the third-most bullish month in the year after April and July. Only Telecommunications (IYZ) has a 50%GRF/50%LRF with a greater %Loss than its %Gain. Including IYZ, six of the thirteen ETFs have greater %Losses than %Gains with none of the thirteen having a greater %LRF than %GRF.
The best performer in October is Utilities (XLU) at 80.00%GRF. However, it carries a significantly higher risk at -5.84%Loss than its average +3.44%Gain. The next best bets are Financials (XLF) and Technology (IYW) at 75.00%GRF and 65.00%GRF respectively.
XLF’s risk is higher than its reward at -7.04%Loss, making it the second-highest %Loss in October, while its potential reward is at 4.66%Gain. IYW has a higher %Gain at 6.51% than its risk at -5.58%Loss. XLU, XLF and IYW all have 20-year averages.
 Aerospace & Defence (PPA) is our fourth-best performer in October over a 17-year average at 61.11%GRF. However, like XLU and XLF, PPA offers a marginally higher %Loss at -5.63% than its %Gain at 5.40%.
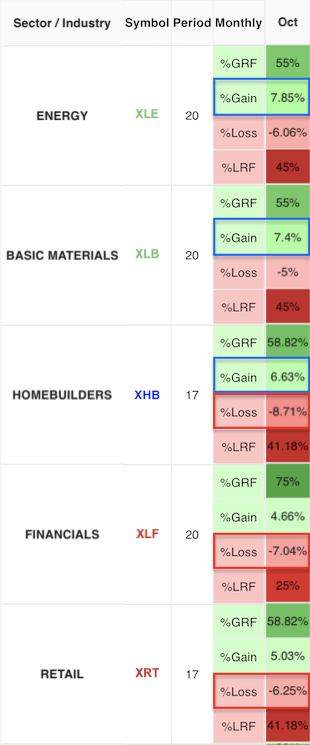
Energy (XLE), is the month’s biggest gainer with an average +7.85%Gain, while Basic Materials (XLB) is second with a +7.40%Gain. Both ETFs carry a 55.00%GRF over a 20-year period with greater %Gains than %Losses.
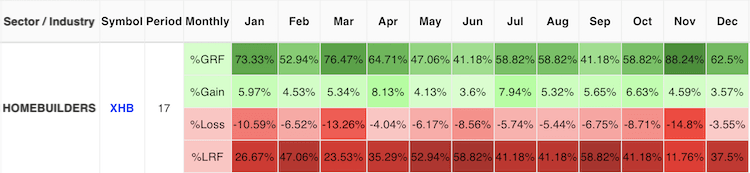
Homebuilders (XHB) are the riskiest prospect for October. It has the third-best potential reward at +6.63%Gain but its risk is the highest at -8.71%Loss over its 17-year history. It does carry a 58.82%GRF if you’re willing to take that risk in a month that’s synonymous with bursting bubbles and market crashes (read Summary below).
The month’s next worst loser is the aforementioned Financials (XLF) at -7.04%Loss while Retail (XRT) is third worst at -6.25%Loss. XRT carries a 58.82%GRF over its 17-year history.
SUMMARY
Going back to the Homebuilders (XHB), it was featured in the Commentary Section in Week 38’s WMO on Sunday 17 September 2023.
“XHB, like all its components within, are reaching or have reached their historical highs and retraced as previously mentioned. That retracement/pull back is not a dip that should be bought into blindly.“
Immediately after that weekend’s analysis, XHB promptly broke below its Diamond and proceeded to decline in Weeks 38 and 39. After two waves to the downside, XHB broke below its channel support line and out of its PhiB-Fan with the 200DSMA approaching.
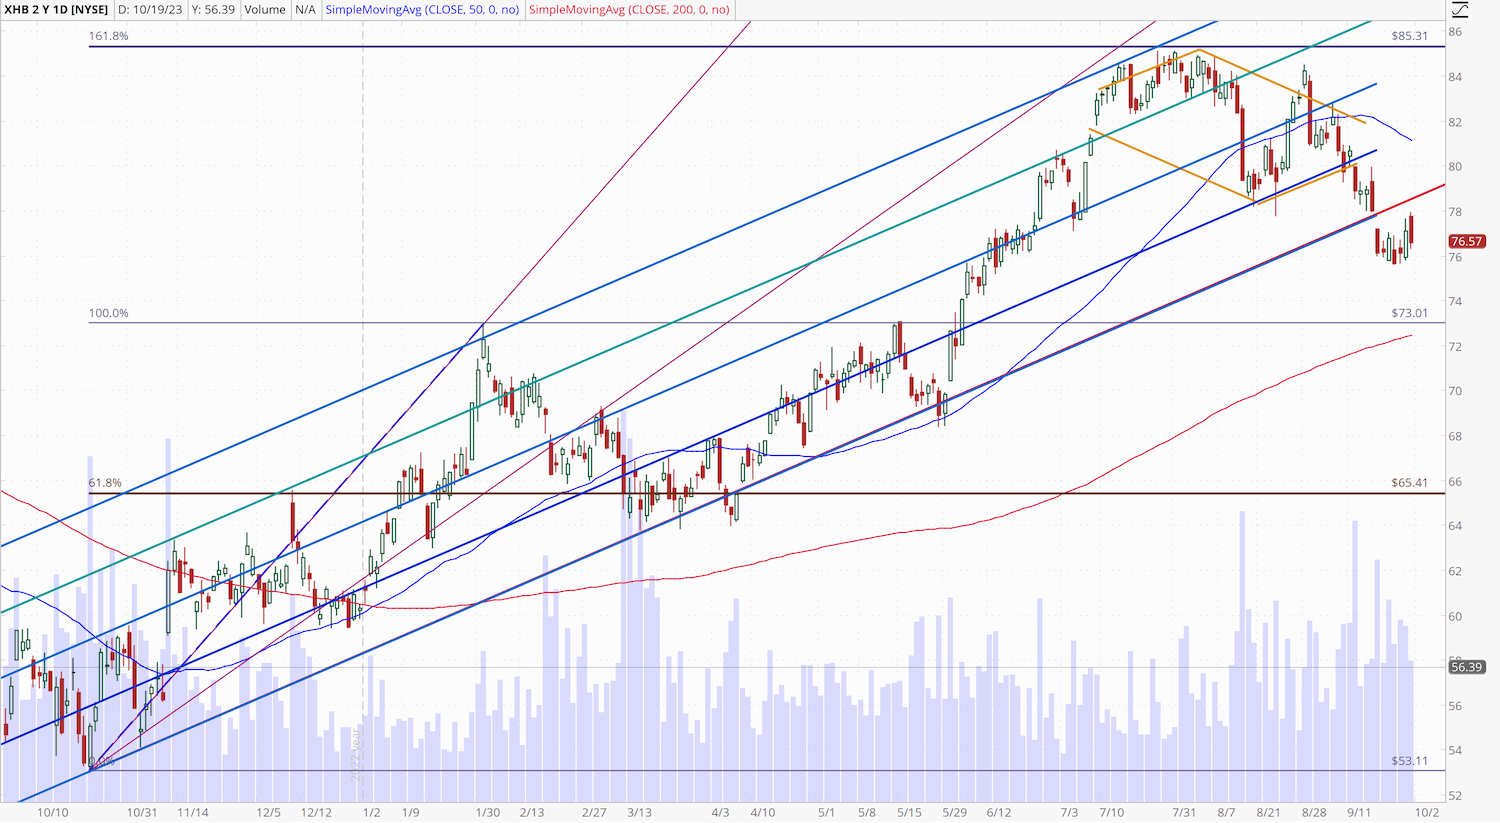
Click to expand
Two interesting observations are that 1) volumes are increasing as they usually do during this period and 2) the ETF has formed a Rounding Bottom pattern at the $76.00 support level.
The Dark Cloud candlestick pattern (from Thursday and Friday) is usually found at the top of uptrends to be effective. Thus, the Thursday-Friday candlestick formation is more of a failed Furiwake pattern that would, in this case, imply more of an upside bias than downside.
Although it was mentioned earlier that XHB carries the highest %Loss risk amongst the ETFs in October, it should be noted that it is coming into its best months to rally between November and April according to our Seasonal Screener’s %GRF.
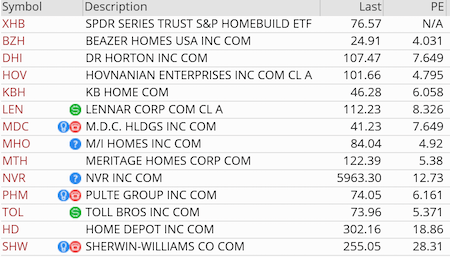 Furthermore, the PE Ratios across almost all the stocks have fallen to become more attractive than two weeks ago.
This is a seasonal play I’ve taken for many years now with more success than failures. Failures should be measured and defended with stops because this is one sector that can tank very suddenly and very badly. Just look at the %Loss across the months and you’ll find that only April, July and December have higher %Gains while every other month’s %Loss is quite considerable over the ETF’s 17 year history.
Let’s not forget that this is one of the few sectors that can bubble in a hurry and has been responsible for some of the worst market and economic downturns in history. So don’t take anything for granted.
This is my parting gift to all of you. I hope it brings great profit for everyone daring to take this risk. Manage it well and don’t get greedy!
Check out the full table of ETFs at our FREE Seasonal Summary Table at Patterntrader.com and join our Pattern Trader Tools discussion page on Facebook.

The Rational Fear Of October
The October Effect refers to the psychological anticipation that financial declines and stock market crashes are more likely to occur during this month than any other month. The Bank Panic of 1907, the Stock Market Crash of 1929, and Black Monday 1987 all happened during the month of October.
Also, it is generally believed that investors return from summer vacation in September ready to lock in gains as well as tax losses before the end of the year. Then there’s a common practice where individual investors liquidate stocks going into September to offset schooling costs for children.
But the big picture begins with the September effect when volumes drop off drastically ahead of October for various reasons including “Portfolio Dumping” by fund managers. The weakened volumes make it very easy for October to get extremely volatile. However, the weaken volumes also make it easy to rally the market in impressive fashion, thus making October a …
“Bear Killer” Month
October has historically heralded the end of more bear markets than the beginning. The fact that it is viewed negatively may actually make it one of the better buying opportunities for contrarians. Slides in 1987, 1990, 2001, and 2002 turned around in October and began long-term rallies. In particular, Black Monday 1987 was one of the greatest buying opportunities of the last 50 years.
Find out all about the “Bear Killer Month” and its historical reliability dating all the way back to 1968 on the Stock Trader’s Almanac; October Outlook: Bear-Killer and Bargain Month
• • • • •


Benchmark Indices ($DJIA, SPX AND COMP 21-year average)
- Week 40 (02 to 06 October) usually starts flat, becomes bearish then turns bullish mid-week and ends poorly.
- First trading day in October (Monday 02) has been down on the DJIA 9 of the last 17 (last year up).
- The first week of October tends to swing up and down.
- Wednesday 04 October is amongst the seventh most bullish sessions of the year.
Benchmark Index ETFs (DIA, SPY 19-Year Average & QQQ 13-Year Average):
- Week 40 (02 to 06 October) usually starts bullish then ends mildly bearish.
Week 40 Key U.S. Economic Notes:
- Monday 02 October – Construction Spending, ISM Manufacturing Index
- Tuesday 03 October – JOLTS – Job Openings
- Wednesday 04 October – MBA Mortgage Applications Index, ADP Employment Change, Factory Orders, ISM Non-Manufacturing Index, EIA Crude Oil Inventories
- Thursday 05 October – Initial Claims, Continuing Claims, Trade Balance, Natural Gas Inventories
- Friday 06 October – Average Workweek, Hourly Earnings, Non-Farm Payrolls, Non-Farm Private Payrolls, Unemployment Rate, Consumer Credit
• • • • •

Benchmark Indices ($DJIA, SPX AND COMP 21-year average)
- Week 41 (09 to 13 October) is flat with mild bullish swings.
- Monday 09 October – Bond Market Closed in observance of Columbus Day.
- The second week of October tends to be more bullish than bearish.
- Q4’s Earnings Season for Q3’s results officially begins this week.
Benchmark Index ETFs (DIA, SPY 19-Year Average & QQQ 13-Year Average):
- Week 41 (09 to 13 October) is mostly bearish and ends very bullish.
Week 41 Key U.S. Economic Notes:
- Monday 09 October – Nothing of note
- Tuesday 10 October – Wholesale Inventories
- Wednesday 11 October – MBA Mortgage Applications Index, PPI, Core PPI, EIA Crude Oil Inventories, Treasury Budget
- Thursday 12 October – Initial Claims, Continuing Claims, CPI, Core CPI, Natural Gas Inventories
- Friday 13 October – Export Prices ex-Ag, Import Prices ex-Oil, UoM Consumer Sentiment-Prelim
• • • • •

Benchmark Indices ($DJIA, SPX AND COMP 21-year average)
- Week 42 (16 to 20 October) has been mostly bullish but ends bearish on Expiration Friday.
- Monday of October Expiration Week has been up on DJIA 30 of the last 40 (last year up).
- The third week of October is the month’s most bullish week but it ends poorly on Expiration Friday.
- Thursday October 19 is the anniversary of the Crash of 1987 – DJIA down 22.6% in one session.
- October Expiration Friday has been up on DJIA 7 of the last 9 (last year up).
Benchmark Index ETFs (DIA, SPY 19-Year Average & QQQ 13-Year Average):
- Week 42 (16 to 20 October) starts bullish then turns bearish midweek for the rest of the week.
Week 42 Key U.S. Economic Notes:
- Monday 16 October – Empire State Manufacturing
- Tuesday 17 October – Retail Sales, Retail Sales ex-Auto, Industrial Production, Capacity Utilisation, Business Inventories, NAHB Housing Market Index, Net Long-Term TIC Flows
- Wednesday 18 October – MBA Mortgage Applications Index, Building Permits, Housing Starts, EIA Crude Oil Inventories, Fed’s Beige Book
- Thursday 19 October – Initial Claims, Continuing Claims, Philadelphia Fed Index, Existing Home Sales, Leading Indicators, Natural Gas Inventories
- Friday 20 October – Nothing of note
Friday, October 20 is options expiration
The last day to trade October equity options.
• • • • •

Benchmark Indices ($DJIA, SPX AND COMP 21-year average)
- Week 43 (23 to 27 October) begins bullish but becomes prone to wild swings midweek onwards.
- The week after October Expiration Week (Week 43) is prone to wild swings.
Benchmark Index ETFs (DIA, SPY 19-Year Average & QQQ 13-Year Average):
- Week 43 (23 to 27 October) starts bullish, becomes bearish midweek and ends bullish.
Week 43 Key U.S. Economic Notes:
- Monday 23 October – Nothing of note
- Tuesday 24 October – Nothing of note
- Wednesday 25 October – MBA Mortgage Applications Index, New Home Sales, EIA Crude Oil Inventories
- Thursday 26 October – Initial Claims, Continuing Claims, Adv. Intl. Trade in Goods, Durable Orders, Durable Goods-ex transportation, GDP-Adv, Chain Deflator-Adv, Pending Home Sales, Natural Gas Inventories
- Friday 27 October – PCE Prices, Core PCE Prices, Personal Income, Personal Spending, UoM Consumer Sentiment-Final
• • • • •

Benchmark Indices ($DJIA, SPX AND COMP 21-year average)
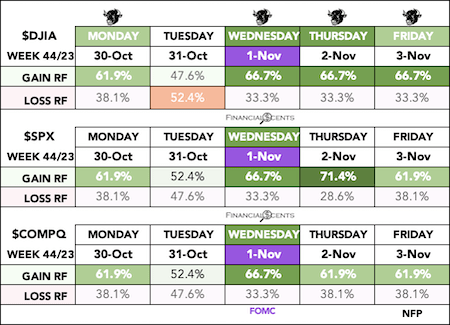
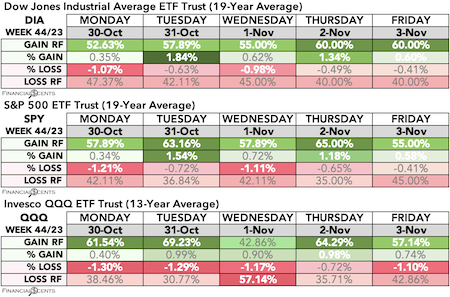
- Week 44 (30 October to 03 November) is mostly bullish
- The second-last day in October tends to be bullish (last year up).
- The first five days of November tend to be quite bullish.
- Wednesday 01 November – FOMC Rate Decision
Benchmark Index ETFs (DIA, SPY 19-Year Average & QQQ 13-Year Average):
- Week 44 (30 October to 03 November) is bullish all the way.
Week 44 Key U.S. Economic Notes:
- Monday 30 October – Nothing of note
- Tuesday 31 October – Chicago PMI, Employment Cost Index, FHFA Housing Price Index, S&P Case-Shiller Home Price Index, Consumer Confidence
- Wednesday 01 November – MBA Mortgage Applications Index, ADP Employment Change, Construction Spending, ISM Manufacturing Index, JOLTS – Job Openings, EIA Crude Oil Inventories, FOMC Rate Decision
- Thursday 02 November – Initial Claims, Continuing Claims, Productivity-Prel, Unit Labor Costs-Prel, Factory Orders, Natural Gas Inventories
- Friday 03 November – Average Workweek, Hourly Earnings, Non-Farm Payrolls, Non-Farm Private Payrolls, Unemployment Rate, ISM Non-Manufacturing Index
• • • • •

The End Of An Era
It’s been a very good 18 years since I took up online trading in spite of its ups and downs. At times, the challenges seemed too much to bear. But the more I was challenged, the more determined I became to master this skill and refused to be defeated by this entity called the market. The business world ruined me in 2000 and I swore to myself back then that I will never be defeated like that again.
I won’t lie to you – it was tough, it has been rough but eventually, it’s more than enough. It’s been a lifetime of risks for me – in business and life in general – and those risks also saw some failures. But those failures never kept me down. For each failure, I came back stronger and wealthier. I can’t take full credit for each fightback because I had support in the form of my friends, associates, my students, my family and most of all, my wife. The effort was more than 100% my own but without that support in the background, the effort would have been for nought.
I’m tired and I need to reward myself for all those struggles, trials and tribulations along my 40-year-long working life of risks. I’m retiring while I’m on top and going on to do other (unrisky) things to add more meaning to my life … while I’m still able and still can.
I wish you all well and good luck on your trading and investing ventures. Keep it safe and keep it simple.
Happy Hunting, Always.
Conrad.
(Facebook Link)