Thursday 21 September 2023 AMC
Interest rate angst creates selling pressure for stocks
The stock market had a downtrend day. The major indices were under pressure from the start, but faded to session lows in the late afternoon trade. The indices ultimately closed near those levels with losses ranging from 1.1% to 1.8%. The S&P 500, which closed just above 4,400 yesterday, spent the whole session below that level today.
The biggest factor driving the weakness was the bump in market rates that started yesterday afternoon in response to the Fed’s hawkish hold. Specifically, the Fed indicated that it may not be done yet raising rates, that it is unlikely to cut rates in 2024 as much as the market had been thinking, and that the neutral rate might be higher than the estimated longer-run rate (2.5%).
The 2-yr note yield was at 5.05% just before yesterday’s FOMC decision was released, but settled at 5.12% today after hitting 5.20% earlier. The 10-yr note yield, at 4.32% just before the FOMC decision was released, rose another 14 basis points from yesterday’s settlement to 4.49% – its highest level since 2007.
Losses were broad based, led by the mega caps and growth stocks. The Vanguard Mega Cap Growth ETF (MGK) fell 2.0% and the Russell 3000 Growth Index fell 1.9%.
Ten of the 11 S&P 500 sectors declined more than 1.0% today. The health care sector (-0.9%) saw the slimmest loss while the real estate sector (-3.5%) registered the sharpest decline by a decent margin.
In other news, the Bank of England voted 5-4 to leave its bank rate unchanged at 5.25%. The Hong Kong Monetary Authority and Swiss National Bank also left their key interest rates unchanged at 5.75% and 1.75%, respectively, whereas the Riksbank and Norges Bank both raised their key interest rates by 25 basis points to 4.00% and 4.25%, respectively.
- Nasdaq Composite: +26.4% YTD
- S&P 500: +12.8% YTD
- S&P Midcap 400: +2.8% YTD
- Dow Jones Industrial Average: +2.8% YTD
- Russell 2000: +1.2% YTD

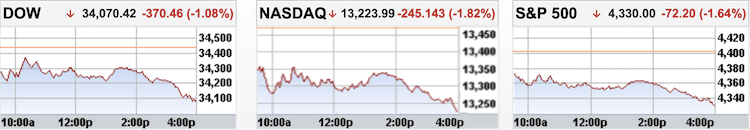
In regular trading on Thursday, the Dow fell 1.08%, the S&P 500 tumbled 1.64% and the Nasdaq Composite plunged 1.82%, with all 11 S&P sectors ending lower led by real estate, consumer discretionary and materials. Those losses came as the 10-year Treasury yields surged to 16-year highs on the back of the central bank’s hawkish tone. Investors were also kept on edge about a government shutdown after House Republican leaders sent the chamber into recess on Thursday.
- DOW closed lower at 34070 (-1.08%)
- NASDAQ closed lower at 13224 (-1.82%)
- S&P 500 closed lower at 4330 (-1.64%)
- Lower than average volume for NYSE but higher for NASDAQ
- NYSE 855 mln vs avg. of 905 mln
- NASDAQ 5,042 mln vs avg. of 4,921 mln
- Advancing/declining volume
- NYSE 95 mln/756 mln
- NASDAQ 1,661 mln/3,335 mln
- Decliners led advancers
- NYSE 462/2,489
- NASDAQ 1,145/3,225
- Lower than average volume for NYSE but higher for NASDAQ
Thursday 21 September 2023 After-hours Action
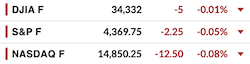
US stock futures were little changed on Friday after the market saw another day of heavy losses during Thursday’s regular session, as the Federal Reserve’s hawkish pause this week continued to weigh on sentiment. The Fed kept interest rates unchanged as widely expected on Wednesday, but signaLled another rate hike before the end of the year and fewer rate cuts than previously indicated next year.
30-Yr Yield Nears 2011 High
Longer-dated Treasuries finished Thursday with sharp losses while the 2-yr note outperformed, though its yield still hit a fresh high for the year. Treasuries recorded the bulk of their losses at the start after a steady overnight slide in the futures market. The overnight retreat took place alongside selling in other sovereign debt amid a flurry of central bank activity that followed the Fed’s hawkish hold. The Hong Kong Monetary Authority followed the Fed’s hold with a pause of its own while the Bank of England left its bank rate at 5.25% against expectations that were split between a pause and another hike. Also in Europe, the Swiss National Bank left its policy rate unchanged at 1.75% while central banks in Sweden and Norway raised their rates by 25 bps apiece. The 5-yr note and shorter tenors recorded lows immediately after the start, inching up off those levels as the day went on, while 10s and 30s faced a bit more pressure in the morning, remaining near their worst levels into the close.
Today’s selling, which widened the 2s10s spread by 12 bps to -66 bps, sent yields to fresh highs for the year with the 30-yr yield now just 24 bps below its high from 2011 and 31 bps below its high from 2010.
-
Bond Yields after the close on Thursday 21 September:
- 3-mth: +1 bp to 5.57%
- 2-yr: unchanged at 5.12%
- 5-yr: +9 bp to 4.61%
- 10-yr: +14 bps to 4.49%
- 30-yr: +16 bps to 4.56%
The yield curve rose in a pivot against the 2-year maturity yield to flatten the key inverted spreads.
The inverted 2-year/10-year yield spread narrowed to -63 bps from -77 bps the previous session.
- The current inversion of the 2/10 which began on Tuesday 5 July 2022 is now three-hundred and seven sessions old, making it the longest period of inversion in 42 years.
- The current inverted 2y/10y spread at -107 bps, printed on Wednesday 08 March 2023, surpassed the previous widest spread printed on Tuesday 07 March 2023 at -103 bps.
- One needs to go back all the way to October 1981 to see a steeper inversion than the current one.
The inverted 3-month/10-year yield spread narrowed to -108 bps from -121 bps the previous session.
- The inverted 3m/10y spread that began on 25 October, is now two hundred and twenty-eight sessions old, making it the longest inversion in 42 years.
- –189 bps printed on Thursday 01 June and Thursday 04 May is the widest inverted spread on the 3m/10y, surpassing the -188 bps printed on Wednesday 01 June and Wednesday 03 May 2023, making it the steepest inversion in 42 years.
- -189 bps surpasses all the previous inverted 3m/10y spreads over the past 50+ years.
The inverted 10-year/Federal Funds Rate spread widened to -98 bps on Wednesday 20 September from -96 bps on Tuesday 19 September.
- The current 10y/FFR inversion which began on Tuesday 15 November 2022 is two hundred and twelve sessions old.
- The -171 bps spread on Thursday 04 May 2023 surpasses the -153 bps spread printed on Wednesday 05 and Thursday 06 April 2023 as the widest of the current inversion in over 22 years.
- The current inversion has surpassed the previous two inversions;
- May 2019 to March 2020
- July 2006 to January 2008
- One needs to go back to 02 January 2001 for a deeper inversion when the 10-year/FFR was at -175 bps.
- By my estimation, the inverted 10y/FFR spread would have narrowed to -84 bps on Thursday 21 September 2023.
![]()
The U.S. Dollar Index revisited its high from March, but eventually narrowed its gain to 0.2% at 105.36.
- Currencies Majors:
- EUR/USD: UNCH at 1.0665
- GBP/USD: -0.4% to 1.2295
- USD/CNH: +0.1% to 7.3127
- USD/JPY: -0.5% to 147.49
Crude oil ended little changed after seeing intraday volatility after Russia announced a temporary ban on exports of gasoline and diesel.
- Crude Oil futures fell $0.20 (-0.22%) to $89.55/barrel
- Nat Gas $0.11 rose (4.18%) to $2.84/MMBtu
- Gold settled today’s session down $28.70 (1.46%) at $1,939.80/oz
- Silver settled today’s session $0.16 lower (0.69%) at $23.70/oz
- Copper settled $0.07 lower (1.78%) at $3.70/lb
Weekly EIA Natural Gas Inventories showed a build of 64 bcf vs a build of 57 bcf last week
Working gas in storage was 3,269 Bcf as of Friday, September 15, 2023, according to EIA estimates. This represents a net increase of 64 Bcf from the previous week. Stocks were 410 Bcf higher than last year at this time and 183 Bcf above the five-year average of 3,086 Bcf. At 3,269 Bcf, total working gas is within the five-year historical range.
Palm Oil Futures Fall to 3-Month Low
Malaysian palm oil futures were below MYR 3,670 per tonne, the lowest in three months, amid weakness in rival oils which offset support from higher exports and a softer ringgit. Shipments of palm oil products from Malaysia for September 1-20 rose 2.4% from a month earlier, cargo surveyor Intertek Testing Services said. Another cargo surveyor, Amspec Agri, mentioned that exports grew by 1.8% during the same period. Meantime, inventory data showed that Malaysian palm oil jumped 22.5% mom at the end of August to a 7-month high of 2.12 million tons. Separately, Kuala Lumpur kept its October export tax for palm oil at 8% and slashed its reference price. Top exporter Indonesia set its crude palm oil reference price at $798.83 per ton for the September 16-30 period, down from $805.20 in the first half of the month. The new reference price puts the export tax and levy at $33 per ton and $85 per ton, respectively.
![]()
Baltic Exchange Dry Index Breaks 11-Session Rally
The Baltic Exchange’s dry bulk sea freight index fell by 15 points to 1,569 points on Thursday, snapping its 11-session winning streak that sent the main index to its highest since May 11th. The capesize index, which tracks vessels typically transporting 150,000-tonne cargoes such as iron ore and coal, also halted its 11-session rally, declining 2.9% to 2,007 points, marking its biggest daily decline since September 5th; and the panamax index, which tracks ships that usually carry coal or grain cargoes of about 60,000 to 70,000 tonnes, edged down by 11 points to 1,696 points. Among smaller vessels, the supramax index added 26 points, or 2%, to 1,350 points.

• • • • •

(Economic Excerpts from Briefing.com)
Initial jobless claims to keep Fed in restrictive mindset
Initial claims for the week ending September 16 declined by 20,000 to just 201,000 (consensus 225,000), hitting their lowest level since January. Continuing jobless claims for the week ending September 9 decreased by 21,000 to 1.662 million.
The key takeaway from the report is that the low level of initial claims shows that the labor market is still operating in a tight mode, which is going to remain a basis for the Fed to keep operating with a restrictive interest rate mindset.
- The four-week moving average for initial claims decreased by 7,750 to 217,000.
- The four-week moving average for continuing claims decreased by 8,750 to 1,687,000.
- The total number of continued weeks claimed for benefits in all programs for the week ending September 2 was 1,678,881, a decrease of 93,267 from the previous week. In the same week a year ago, there were 1,295,610 weekly claims filed for benefits in all programs.
Higher rates, higher prices, and limited supply
continue to crimp existing home sales in August
Existing home sales decreased 0.7% month-over-month in August to a seasonally adjusted annual rate of 4.04 million (consensus 4.10 million) from an unrevised 4.07 million in July. Sales were down 15.3% from the same period a year ago.
The key takeaway from the report is that existing home sales continue to be crimped by a confluence of factors: higher mortgage rates and higher prices that are hurting affordability; limited supply; a lack of mobility due to remote work opportunities; and disinterest in moving by existing homeowners who are reluctant to give up a low-rate mortgage for a higher-rate mortgage.
- The median existing home price for all housing types increased 3.9% year-over-year to $407,100, the third consecutive month it was above $400,000. The median price for single-family homes increased 3.7% year-over-year to $413,500.
- Existing home sales across regions: Northeast (unchanged); Midwest (+1.0%); South (-1.1%); and West (-2.6%).
- Median home prices by region year-over-year: Northeast (+5.8% to $465,700); Midwest (+6.8% to $305,300); South (+3.2% to $366,100); and West (+1.0% to $609,300).
- The inventory of homes for sale at the end of August was 1.10 million units, down 0.9% from July and down 14.1% from a year ago.
- Unsold inventory sits at a 3.3-month supply at the current sales pace, unchanged from July and versus 3.2 months in August 2022. It remains well below the 6.0-months’ supply typically associated with a more balanced market.
- First-time buyers accounted for 29% of sales in August, versus 30% in July and 29% a year ago.
- All-cash sales comprised 27% of transactions in August, up from 26% in July and 24% in August 2022.
- 72% of homes sold in August were on the market for less than a month. Properties typically remained on the market for 20 days, the same as July and up from 16 days in August 2022.
Philadelphia Factory Activity Shrinks More than Expected
The Philadelphia Fed Manufacturing Index in the US fell to -13.5 in September 2023, down from 12 in August and worse than market forecasts of -0.7. The indicators for new orders (-10.2 vs 16), and shipments (-3.2 vs 5.7) declined into negative territory. The firms continued to report overall increases in both the prices paid index (25.7 vs 20.8) and the prices received index (14.8 vs 14.1) and an overall decline in employment (-5.7 vs -6). The survey’s future indexes improved, suggesting more widespread expectations for growth over the next six months.
Q2 Current Account Balance -$212.1 vs -$222.0 bln consensus
Prior revised to -$214.5 bln from -$219.3 bln
August Leading Indicators -0.4% vs -0.4% consensus
Prior revised to -0.3% from -0.4%
US Mortgage Rates Approach 22-Year High
The average rate on a 30-year fixed mortgage was at 7.19% as of September 21st, 2023, rising 1bp from the prior week to reapproach the 22-year high of 7.23% touched on August 23rd, tracking the surge in US bond yields. The average mortgage rate was at 6.29% in the corresponding week of the previous year. “Mortgage rates continue to linger above seven percent as the Federal Reserve paused their interest rate hikes,” said Sam Khater, Freddie Mac’s Chief Economist. “Given these high rates, housing demand is cooling off and now homebuilders are feeling the effect. Builder sentiment declined for the first time in several months and construction levels have dipped to a three-year low, which could have an impact on the already low housing supply.”
- Fed hints at higher neutral rate. WSJ
White House released yesterday fact sheet on U.S. Action on Global Development
- At the halfway point to 2030, the world is not where it needs to be. Globally, we are only on track to achieve 15 percent of the SDG targets. Yet, if all countries act with urgency and redouble action and investments across the Sustainable Development Goals, while deepening and expanding partnerships across goal areas, we can achieve these ambitious goals. The United States is committed to the full implementation of 2030 Agenda and the SDGs, at home and abroad. As a long-standing leader on global development, the United States is committed to reinvigorating action on this agenda alongside our partners around the world. The United States remains the single largest bilateral donor — investing over $100 billion in Official Development Assistance over the last two years alone. This includes over $43 billion to help end poverty (SDG 1); over $20 billion to drive inclusive economic growth and decent work (SDG 8); and over $16 billion to promote peace, justice, and good governance (SDG 16). The United States is also the largest provider of humanitarian aid at a time of unprecedented need — investing more than $42 billion more since the Biden Administration began.
- The United States recognizes the integrated and universal nature of all of the SDGs, and is responding to the calls of our partner countries to address the issues most important to them, including:
- Inclusive Economic Growth and Infrastructure Investment
- Global Health and Health Security
- Resilient and Sustainable Food Systems and Food Security
- Clean and Climate Resilient Economies
- Digitalization and New Technologies
![]()
Bank of England leaves key interest rate unchanged at 5.25%
The Bank of England held its policy interest rate at 5.25% on September 21st, keeping borrowing costs at their highest level since 2008, as policymakers opted for a wait-and-see approach following the latest inflation and labor data, which suggested that the accumulated impacts of previous policy tightening might be taking effect. It was the first pause in policy tightening in nearly two years, following the central bank’s unprecedented 515 bps hikes. The Monetary Policy Committee voted 5-4 in favor of holding rates steady, with four members advocating for an additional 25 bps increase. The central bank also stated that CPI inflation is expected to decline significantly in the near term, reflecting lower energy inflation, despite renewed upward pressure from oil prices, and further declines in food and core goods price inflation. Policymakers have reiterated their commitment to tightening policy further if deemed necessary.


- Hong Kong’s August CPI 0.0% m/m (last 0.0%); 1.8% yr/yr (expected 2.0%; last 1.8%)
- New Zealand’s Q2 GDP 0.9% qtr/qtr (expected 0.5%; last 0.0%); 1.8% yr/yr (expected 1.2%; last 2.2%). Q2 GDP Expenditure 1.3% qtr/qtr (last -0.2%)
- China’s State Cabinet pledged to speed up the development of advanced manufacturing.
- Former Reserve Bank of Australia Governor Macfarlane said that new Governor Bullock risks losing control over the RBA board due to structural changes.
- There were growing hopes that Chevron and its LNG workers in Australia will reach a contract agreement on Friday.
- The Hong Kong Monetary Authority held its policy rate at 5.75%, as expected.
Equity indices in the Asia-Pacific region ended Thursday on a lower note. The Shanghai Composite seemed to fall under the spell of the rest of the global indices on a day without any economic data from the mainland. In Japan, heavyweight SoftBank weighed down the Nikkei, taking a 3% hit. Financials bucked the overall tone, with banks such as Mizuho Financial Group, Mitsubishi UFJ Financial Group, and Sumitomo Mitsui Financial Group advancing by 1%.
- Japan’s Nikkei: -1.4%
- Hong Kong’s Hang Seng: -1.3%
- China’s Shanghai Composite: -0.8%
- India’s Sensex: -0.9%
- South Korea’s Kospi: -1.8%
- Australia’s ASX All Ordinaries: -1.3%
- Malaysia’s FKLCI: -0.2%
- Singapore’s STI: -1.2%

- U.K.’s August Public Sector Net Borrowing GBP10.76 bln (expected GBP9.80 bln; last -GBP1.20 bln)
- France’s September Business Survey 99 (expected 97; last 97)
- Spain’s July trade deficit EUR4.90 bln (last deficit of EUR2.36 bln)
- The Bank of England left its bank rate at 5.25% against expectations that were split between a pause and another hike.
- The Swiss National Bank also left its policy rate unchanged, at 1.75%, while central banks in Sweden and Norway raised their rates by 25 bps apiece.
- European Central Bank policymaker Nagel said that it is unclear if rates have peaked while policymaker Kazaks said that rates will have to remain restrictive for quite a while.
- Poland’s Prime Minister Morawiecki said that his country will no longer arm Ukraine.
Equity markets in Europe fell on Thursday, with the German DAX and the benchmark Stoxx 600 down 1.3% each, dragged by travel and leisure stocks as well as mining companies. The BoE surprised the market by leaving interest rates unchanged, citing expectations of a significant decrease in inflation in the near term but keeping the door open for potential future rate hikes. In other regions, the SNB unexpectedly halted its tightening of monetary policy, while the central banks of Sweden and Norway raised interest rates by 25 basis points. Meanwhile, in the US, the Federal Reserve maintained its current interest rates but signaled the possibility of another rate hike before the year’s end and fewer rate cuts in the upcoming year compared to previous expectations. In Frankfurt the DAX Index decreased 208 points or 1.32 percent.
Equities in London closed a choppy session 0.7% lower at 7,679 on Thursday, pressured by worries over a hawkish Fed as markets assessed the Bank of England’s monetary policy decision. The BoE held its Bank Rate unchanged at 5.25%, its first hold in nearly two years. Financial markets were evenly split on whether the central bank would increase borrowing costs, backtracking the previous consensus of a 25bps rate hike after yesterday’s inflation print raised hopes of fast disinflation in the British economy. While the hold suggested that the MPC is alert for overtightening risks, the outlook of prolonged restrictive policy still laid pressure on stocks. Stocks were also lowered as renewed evidence of a tight US labor market magnified the hawkish signals from the Federal Reserve in yesterday’s decision.
- U.K.’s FTSE 100: -0.7%
- Germany’s DAX: -1.3%
- France’s CAC 40: -1.6%
- Italy’s FTSE MIB: -1.8%
- Spain’s IBEX 35: -1.0%
- STOXX Europe 600: -1.3%

• • • • •

Friday 22 September 2023.
Friday 22 September is the fifth-most bearish session of the year.
The Stock Trader’s Almanac’s stats for the Benchmark Indices for Friday of Week 38 over a 21-year average are;
- Dow Jones (DJIA): Very Bearish 71.4%
- S&P 500 (SPX): Very Bearish 71.4%
- NASDAQ (COMP): Bearish 61.9%
![]()
The Pattern Trader™ Tools Screener stats for the Benchmark Index ETFs for Friday of Week 38;
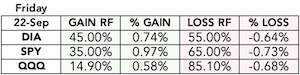
- SPDR DJIA ETF Trust (DIA – 19yr Avg): Bearish 55.00%
- SPDR S&P 500 ETF Trust (SPY – 19yr Avg): Quite Bearish 65.00%
- Invesco QQQ Trust Series I (QQQ – 13yr Avg): Insanely Bearish 85.10%
Friday 22 September
- Australia – Flash Manufacturing PMI, Flash Services PMI
- Japan – Flash Manufacturing PMI, National Core CPI y/y, BOJ Policy Rate, Monetary Policy Statement, BOJ Press Conference
- EU –
- Eurozone Flash Manufacturing PMI, Flash Services PMI
- German Flash Manufacturing PMI, Flash Services PMI, Import Prices m/m
- French Flash Manufacturing PMI, Flash Services PMI
- UK – Flash Manufacturing PMI, Flash Services PMI, GfK Consumer Confidence, Retail Sales m/m, CBI Industrial Order Expectations
- US –
- S&P Global US Manufacturing PMI – Prelim
- S&P Global US Services PMI – Prelim

From Wednesday’s DMA;
“Now its over to the BoE and BoJ and a whole bunch of PMIs to see if those numbers can quell what I think is going to be a violent (I meant to type volatile) end to the week.“
With yields hitting (more than) decade highs in the most bearish two weeks of the year, I reckon things are going to get more bearish before the end of the month. The September Portfolio Dumping season is afoot. From hereon, I’m expecting one catalyst to trigger another starting with the dollar and oil prices to rise further and give the market even more to worry about.

Copyright© 2023 FinancialScents Pte Ltd
~~~~~~~~~~~~~~~~~~~~~~~~~~~~~~~~~~~~

After 17 years of educating, mentoring and supporting hundreds of participants (annually) in the arts and sciences of Finance and Economics, the Pattern Trader™ Tutorial has evolved to become the most exclusive and sought-after boutique-styled mentorship that caters to retail individuals, institutional professionals, businesses and families that are serious about their finances and their prospects as we move into the future.
Enriching, Fulfilling, Life Changing

The personal mentorship and tutorial-styled approach delivers a conducive environment that allows for close communication and interaction between the mentor and the participant. The hands-on style makes the Tutorial very practical for anyone who requires a start from the ground up. It is the perfect beginning for anyone who wishes to take that first step in improving their financial and economic literacy.
If you’re looking to make a huge difference in your financial life and get the most value for your education investment, there’s no better choice than the time-tested and well reputed Pattern Trader™ Tutorial
Download our promo slides here: The Pattern Trader™ Tutorial

~~~~~~~~~~~~~~~~~~~~~~~~~~~~~~~~
Write to support@patterntrader.com for queries and further information.