Wednesday 20 September 2023 AMC
Market tripped up by Fed’s thinking
The stock market started the session with a positive bias as participants waited for the 2:00 p.m. ET release of the FOMC decision. The early upside moves were supported by falling oil prices and market rates. The Nasdaq had a modest loss in the early going, due to lagging mega caps, but the A-D line was positive and the other major indices were in the green.
Both the stock and bond market experienced volatile price action following the September FOMC Statement. As expected, the FOMC voted unanimously to leave the target range for the fed funds rate unchanged at 5.25-5.50%. There were few changes to the directive itself, but the market was focused on the Summary of Economic Projections and dot plot, which conveyed two key takeaways: (1) Policy rates are anticipated to remain higher for longer and (2) Fed officials are not expecting to cut rates in 2024 as much as they were anticipating when they updated their forecasts in June.
The median fed funds rate estimate for 2023 was unchanged at 5.6%, but the median estimate for 2024 was 5.1%, versus 4.6% in June. The former estimate suggests officials are still leaning in favor of one more rate hike this year, whereas the latter revision connotes an expectation that rates will come down by only 50 basis points in 2024, as opposed to 100 basis points when estimates were provided in June. Meanwhile, the median estimate for 2025 was 3.9% versus 3.4% in June, and a median estimate of 2.9% was introduced for 2026. The longer-run fed funds rate estimate was maintained at 2.5%, leaving one to infer that the Fed is going to stay committed to its 2.0% inflation target.
The turbulent price action continued as Fed Chair Powell gave his press conference. Mr. Powell said several times that the Fed is going to “proceed carefully” when thinking about making a policy move, but said it’s plausible that the neutral rate is higher than the longer run rate (2.5%), which he said is part of the explanation for why the economy has been more resilient than expected.
The wrinkle for the market wasn’t that the Fed is decidedly hawkish at this point, it was that the Fed is still not dovish.
Stock settled into a steady decline in the late afternoon, led by the mega caps, that left the S&P 500 just above the 4,400 level. The Vanguard Mega Cap Growth ETF (MGK) fell 1.6% versus a 0.9% decline in the market-cap weighted S&P 500.
Most of the S&P 500 sectors closed in the red with communication services (-1.9%) and information technology (-1.8%) logging the biggest declines. The consumer staples sector (+0.2%) led the outperformers.
Klaviyo (KVYO), which priced its IPO at $30, traded as high as $37 before pulling back with the rest of the market in the afternoon trade.
Treasury yields settled the session mixed compared yesterday, but well off their lows for the day. The 2-yr note yield, at 5.05% just before 2:00 p.m. ET, settled at 5.12%. The 10-yr note yield, at 4.32% just before 2:00 p.m. ET, settled at 4.35%.
- Nasdaq Composite: +28.7% YTD
- S&P 500: +14.7% YTD
- S&P Midcap 400: +4.7% YTD
- Dow Jones Industrial Average: +3.9% YTD
- Russell 2000: +2.8% YTD

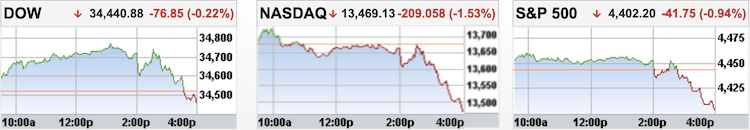
The Dow closed 76 points lower on Wednesday, while the S&P 500 and the Nasdaq declined by 0.9% and 1.5%, respectively, as markets assessed the Federal Reserve’s monetary policy outlook following its largely expected hold.
- DOW closed lower at 34441 (-0.22%)
- NASDAQ closed lower at 13469 (-1.53%)
- S&P 500 closed lower at 4402 (-0.94%)
- Lower than average volume
- NYSE 768 mln vs avg. of 906 mln
- NASDAQ 4,822 mln vs avg. of 4,922 mln
- Advancing/declining volume
- NYSE 265 mln/489 mln
- NASDAQ 1,918 mln/2,834 mln
- Decliners led advancers
- NYSE 1,170/1,735
- NASDAQ 1,450/2,940
- Lower than average volume
Wednesday 20 September 2023 After-hours Action
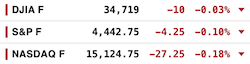
US index futures were slightly lower three hours into the close on Wednesday. In after-hours action, FedEx gained 5% after the delivery company posted adjusted earnings of $4.55 per share in its fiscal first quarter, while analysts called for $3.73 per share, per LSEG. Homebuilder KB Home fell 2%, despite exceeding Wall Street’s earnings expectations on the top and bottom line. These moves follow a bleak ending to Wednesday’s trading session.
FOMC Solidifies “Higher for Longer” Narrative
U.S. Treasuries ended the midweek session on a mixed note after reversing from highs in reaction to the FOMC Statement for September. Treasuries spent the first few hours of action in a slow rise that pressured yields on 10s and shorter tenors from their highest levels of the year. The early advance sent yields back to yesterday’s lows, but the entire complex succumbed to renewed selling pressure as the market received the September FOMC Statement. As expected, the Statement did not call for another rate hike at this time, but the accompanying economic projections pointed to a higher degree of hawkishness among policymakers. The FOMC maintained its median rate forecast for this year, but the forecast for 2024 was increased to 4.60-5.40% from 4.40-5.10%. This means that the FOMC currently sees only about 50 bps of potential rate cuts next year, down from 100 bps in June. With regards to inflation, the FOMC lowered its median core PCE inflation forecast for this year to 3.7% from 3.9% while the forecast for 2024 was left unchanged at 2.6%. During his press conference, Fed Chairman Powell repeated that slowing inflation will require a period of below-trend GDP and that full effects of tightening have not been seen yet. The post-FOMC volatility sent the 2-yr note back into the red while longer tenors finished closer to the midpoint of today’s range.
-
Bond Yields after the close on Wednesday 20 September:
- 3-mth: +2 bp to 5.56%
- 2-yr: +4 bps to 5.12%
- 5-yr: +1 bp to 4.52%
- 10-yr: -2 bps to 4.35%
- 30-yr: -3 bps to 4.40%
The yield curve pivoted on its belly with its short-term maturity yields rising while its long-term maturity yields fell, steepening the key inversions yet again.
The inverted 2-year/10-year yield spread widened to -77 bps from -71 bps the previous session.
- The current inversion of the 2/10 which began on Tuesday 5 July 2022 is now three-hundred and six sessions old, making it the longest period of inversion in 42 years.
- The current inverted 2y/10y spread at -107 bps, printed on Wednesday 08 March 2023, surpassed the previous widest spread printed on Tuesday 07 March 2023 at -103 bps.
- One needs to go back all the way to October 1981 to see a steeper inversion than the current one.
The inverted 3-month/10-year yield spread widened to -121 bps from -117 bps the previous session.
- The inverted 3m/10y spread that began on 25 October, is now two hundred and twenty-seven sessions old, making it the longest inversion in 42 years.
- –189 bps printed on Thursday 01 June and Thursday 04 May is the widest inverted spread on the 3m/10y, surpassing the -188 bps printed on Wednesday 01 June and Wednesday 03 May 2023, making it the steepest inversion in 42 years.
- -189 bps surpasses all the previous inverted 3m/10y spreads over the past 50+ years.
The inverted 10-year/Federal Funds Rate spread narrowed to -96 bps on Tuesday 19 September from -101 bps on Monday 18 September.
- The current 10y/FFR inversion which began on Tuesday 15 November 2022 is two hundred and eleven sessions old.
- The -171 bps spread on Thursday 04 May 2023 surpasses the -153 bps spread printed on Wednesday 05 and Thursday 06 April 2023 as the widest of the current inversion in over 22 years.
- The current inversion has surpassed the previous two inversions;
- May 2019 to March 2020
- July 2006 to January 2008
- One needs to go back to 02 January 2001 for a deeper inversion when the 10-year/FFR was at -175 bps.
- By my estimation, the inverted 10y/FFR spread would have widened to -98 bps on Wednesday 20 September 2023.
![]()
DXY Gains Ground after Fed
The U.S. Dollar Index rose 0.1% to 105.33 after the Federal Reserve signalled a hike may be still on the table. The Fed kept the target range for the fund’s rate at 5.25%-5.5% but projections released in the dot-plot showed the likelihood of one more increase this year, then only two cuts in 2024. As a result, the Japanese yen weakened past 148 per dollar, the lowest since early November as the Bank of Japan is expected to keep its key short-term interest rate at -0.1% on Friday. Also, the Euro was down 0.2% after last week the European Central Bank increased rates by 25 basis points to reach fresh multi-year highs and signaled that it had likely completed its tightening cycle. Finally, the pound extended the decline to $1.234, its lowest point since the end of May, as investors reduced their expectations for future rate hikes by the Bank of England, in light of lower-than-anticipated inflation data.
- Currencies Majors:
- EUR/USD: UNCH at 1.0681
- GBP/USD: -0.3% to 1.2355
- USD/CNH: UNCH at 7.3012
- USD/JPY: +0.2% to 148.03
Euro Falls Below $1.07
The euro fell below $1.07 after the Federal Reserve kept the target range for the fund’s rate at 5.25%-5.5% but signaled a hike may be still on the table. Projections released in the dot-plot showed the likelihood of one more increase this year, then only two cuts in 2024. On the other hand, last week, the European Central Bank increased rates by 25 basis points to reach fresh multi-year highs and signaled that it had likely completed its tightening cycle. Meanwhile, data released on Wednesday showed that German producer prices recorded their largest year-on-year decline in August since data collection began in 1949, raising hopes for further easing of inflation in Europe’s largest economy.
Japanese Yen Touches 148
The Japanese yen weakened past 148 per dollar, the lowest since early November as the divergence between monetary policy in the US and Japan became more pronounced. The Federal Reserve kept the target range for the fund’s rate at a 22-year high of 5.25%-5.5% on September 20th but signaled there could be another hike this year. On the other hand, the Bank of Japan has maintained its key short-term interest rate at -0.1% since 2006. Traders now look ahead to the BOJ’s policy decision at the end of the week but even if the central bank decides to bring the rates into positive territory it is unlikely that the yen will regain ground in the medium term.
Crude Oil Pulls Back From 10-Month High
Crude oil backed off its highest level ($91.98) since early November to settle above $90.2 per barrel on Wednesday, hovering close to over ten-month highs after the EIA report showed that US crude inventories fell by 2.135 million barrels last week, broadly in line with market expectations of a 2.2 million draw. On Tuesday, the API report pointed to a bigger 5.25 million barrels decline. The US Energy Information Administration also said on Monday that US oil output from top shale-producing regions is on track to decline for the third straight month to 9.393 million barrels per day in October, the lowest since May. Moreover, Russia’s government is reportedly considering imposing export duties on all types of oil products at $250 per metric ton from Oct. 1 until June 2024 to counter fuel shortages, according to Reuters.
- Crude Oil futures fell $0.74 (-0.82%) to $89.75/barrel
- Nat Gas $0.11 fell (-3.98%) to $2.73/MMBtu
- Gold settled today’s session up $16.10 (0.82%) at $1,968.50/oz
- Silver settled today’s session $0.40 higher (1.68%) at $23.86/oz
- Copper settled $0.02 higher (0.52%) at $3.77/lb
Gold Pares Some Gains after Fed
Gold pared some of the early gains but settled around the $1967 an ounce level on Wednesday after the Fed kept the fed funds rate steady but signalled one more interest rate increase this year. Also, policymakers in the US revised their interest rate projections up for next year, reiterating the view that borrowing costs will stay higher for longer. Meanwhile, the Bank of England is set to decide on monetary policy tomorrow and investors remain split on whether the central bank will raise rates again or pause the rate-hike campaign. The Bank of Japan will also provide an update on monetary policy on Friday.
EIA petroleum data for the week ended Sep 15
- Crude oil inventories had a draw of 2.14 mln barrels
- Prior week showed a build of 3.96 mln barrels
- Gasoline inventories had a draw of 831K barrels
- Prior week showed a build of 5.56 mln barrels
Summary of Weekly Petroleum Data for the week ending September 15, 2023
U.S. crude oil imports averaged 6.5 million barrels per day last week, decreased by 1.1 million barrels per day from the previous week. Over the past four weeks, crude oil imports averaged about 6.9 million barrels per day, 7.9% more than the same four-week period last year. Total motor gasoline imports (including both finished gasoline and gasoline blending components) last week averaged 511 thousand barrels per day, and distillate fuel imports averaged 83 thousand barrels per day.
U.S. commercial crude oil inventories (excluding those in the Strategic Petroleum Reserve) decreased by 2.1 million barrels from the previous week. At 418.5 million barrels, U.S. crude oil inventories are about 3% below the five year average for this time of year. Total motor gasoline inventories decreased by 0.8 million barrels from last week and are about 3% below the five year average for this time of year. Finished gasoline inventories increased, while blending components inventories decreased last week. Distillate fuel inventories decreased by 2.9 million barrels last week and are about 14% below the five year average for this time of year. Propane/propylene inventories increased 1.6 million barrels from last week and are 20% above the five year average for this time of year. Total commercial petroleum inventories increased by 3.0 million barrels last week.
Palm Oil Trades Below MYR 3,750 for 3rd Day
Malaysian palm oil futures were trading below MYR 3,750 per tonne for the third day, rattled by weak shipments and higher inventories. Exports of palm oil products from Malaysia for Sept. 1-15 fell 11.8% from a month earlier, cargo surveyor Intertek Testing Services said. Another cargo surveyor, Amspec Agri, mentioned that exports declined 9.3% during the first 15 days of September. Meantime, inventory data showed that Malaysian palm oil jumped 22.5% mom at the end of August to a 7-month high of 2.12 million tons. Separately, Kuala Lumpur kept its October export tax for palm oil at 8% and slashed its reference price. Limiting the downward momentum was the prospect of robust demand from China following a deal between Malaysian palm oil firm Sime Darby Oils and China’s Guangxi Beibu Gulf Intl. Meantime, top palm oil buyer India imported 1.13 million metric tons of palm oil in August, a 3.9% increase mom to the highest in 9 months, as the country is heading for a festive season.
![]()
Baltic Exchange Dry Index Up For 11th Session
The Baltic Exchange’s dry bulk sea freight index advanced for the 11th straight session on Wednesday, rising 3.8% to its highest since May 11 at 1,584 points, amid stronger demand for all vessel segments. The capesize index, which tracks vessels typically transporting 150,000-tonne cargoes such as iron ore and coal, increased for the 11th straight session, surging 6.4% to a near three-month high of 2,067 points. “Recently, Capes have seen a boost on firmer activity in both the Atlantic and Pacific basins,” analysts at Jefferies said. At the same time, the panamax index, which tracks ships that usually carry coal or grain cargoes of about 60,000 to 70,000 tonnes, rose 14 points to its highest since April 13 at 1,707 points; and the supramax index added 38 points, or 3% to 1,324 points.

• • • • •

(Economic Excerpts from Briefing.com)
US Mortgage Rates Back to 2000-Highs
The average contract interest rate for 30-year fixed-rate mortgages with conforming loan balances ($726,200 or less) in the US rose by 4bps to 7.31% in the week ended September 15th 2023. Borrowing costs came back to 23-year highs hit in August. A year ago, rates were about a full percentage point lower at 6.25%. The average loan size on a purchase application was $416,800, the highest level in six weeks.
US Mortgage Applications Rise the Most in 3 Months
Mortgage applications in the US jumped 5.4% in the week ending September 15th, 2023, the first rise in three weeks, and the biggest since mid-June, data from the Mortgage Bankers Association data showed. Applications to refinance a home loan soared 13.2% and those to buy a home rose 2.3%. Meanwhile, the average contract interest rate for 30-year fixed-rate mortgages with conforming loan balances ($726,200 or less) edged up by 4bps to 7.31%, back to high levels not seen since December 2000. “Purchase applications increased for conventional and FHA loans over the week. Homebuyers continue to face higher rates and limited for-sale inventory, which have made purchase conditions more challenging”, said Joel Kan, an MBA economist.
![]()
FOMC leaves target range for fed funds rate unchanged
at 5.25-5.50%, as expected; vote was unanimous
Summary of Economic Projections altered to show only 50 basis points of potential rate cuts in 2024 versus 100 basis points at time of June projections.
- Longer-run rate left unchanged at 2.5%
- Change in real GDP for 2023 revised to 2.5% from 1.0%
- 2023 unemployment rate expected to be 3.8% versus 4.1% in June projection
- 2023 Core PCE inflation estimate dips to 3.7% from 3.9%
The takeaway from the table was twofold:
- Policy rates are anticipated to remain higher for longer and
- Fed officials are not expecting to cut rates in 2024 as much as they were anticipating when they updated their forecasts in June.
The median fed funds rate estimate for 2023 was unchanged at 5.6%, but the median estimate for 2024 was 5.1%, versus 4.6% in June. The former estimate suggests officials are still leaning in favor of one more rate hike this year, whereas the latter revision connotes an expectation that rates will come down by only 50 basis points in 2024, as opposed to 100 basis points when estimates were provided in June. Meanwhile, the median estimate for 2025 was 3.9% versus 3.4% in June, and a median estimate of 2.9% was introduced for 2026. The longer-run fed funds rate estimate was maintained at 2.5%, leaving one to infer that the Fed is going to stay committed to its 2.0% inflation target.
Fed releases updated projections from September meeting
Sees 2023 PCE median inflation of 3.3% from 3.2% prior forecast; sees 2023 fed funds rate between 5.4-5.6%, unchanged from June; sees 2024 fed funds rate between 4.6% and 5.4% from 4.4-5.1% in June

General Mills (GIS) beats by $0.06, reports revs in-line; reaffirms FY24 EPS guidance.
- Reports Q1 (Aug) earnings of $1.14 per share, $0.06 better than the FactSet Consensus of $1.08; revenues rose 4.0% year/year to $4.9 bln vs the $4.88 bln FactSet Consensus.
- Co reaffirms guidance for FY24, sees EPS of +4-6% yr/yr to ~$4.47-4.56 vs. $4.47 FactSet Consensus.
- Co also reaffirms Organic net sales are expected to increase 3 to 4%
- Free cash flow conversion is expected to be at least 95 percent of adjusted after-tax earnings.
FedEx (FDX) beats by $0.84, reports revs in-line; guides FY24 EPS in-line, expects flat yr/yr revs; to repurchase additional $1.5 bln of stock during FY24.
- Reports Q1 (Aug) earnings of $4.55 per share, excluding non-recurring items, $0.84 better than the FactSet Consensus of $3.71; revenues fell 6.5% year/year to $21.68 bln vs the $21.74 bln FactSet Consensus.
- FedEx Express operating income increased 18% during the quarter, as a 9% decline in revenue was more than offset by reduced operating expenses. Cost reductions and transformation efforts that benefited the quarter included structural flight reductions, the alignment of staffing with volume levels, parking aircraft, and shifting to one delivery wave per day in the U.S.
- FedEx Ground operating income increased 59% during the quarter primarily due to yield improvement and cost reductions. Cost per package declined more than 2%, driven by lower line-haul expense and improved dock and first- and last-mileproductivity.
- FedEx Freight operating income decreased 26% during the quarter driven by lower fuel surcharges and shipments, partially offset by base yield improvement. FedEx Freight completed the planned closure of 29 terminal locations during August.
- Co issues in-line guidance for FY24, sees EPS of $17.00-18.50 (up at the low end from $16.50-18.50), before the MTM retirement plans accounting adjustments and excluding costs related to business optimization initiatives, vs. $17.49 FactSet Consensus.
- Co expects FY24 (May) revs to remain flat yr/yr, narrowed from its previous forecast of flat to low-single-digit percent growth. FactSet Consensus calls for -0.5% growth yr/yr.
- Co expects to repurchase an additional $1.5 billion of common stock during fiscal 2024 after completing a $500 mln accelerated share repurchase transaction during the quarter.
KB Home (KBH) beats by $0.37, beats on revs, deliveries decreased 7%, housing gross profit margin decreased 520 bps; Raises FY23 housing revenue guidance.
- Reports Q3 (Aug) earnings of $1.80 per share, $0.37 better than the FactSet Consensus of $1.43; revenues fell 14.0% year/year to $1.59 bln vs the $1.47 bln FactSet Consensus.
- Homes delivered decreased 7% to 3,375.
- Net orders for the third quarter grew 52% to 3,097, and net order value rose 54% to $1.51 billion.
- Average selling price was $466,300, compared to $508,700.
- The Company’s housing gross profit margin of 21.5% decreased 520 basis points. Excluding the inventory-related charges associated with housing operations of $.6 million in the current quarter and $5.9 million in the year-earlier quarter, the housing gross profit margin remained at 21.5% and was down from 27.0%, primarily due to price decreases and other homebuyer concessions, higher construction costs and a shift in the mix of homes delivered.
- Guidance: Sees FY23 housing revenue of $6.31 bln vs. prior guidance of $5.80-$6.20 bln. Sees average selling price of approximately $481,000 and housing gross profit margin of approximately 21.3%, assuming no inventory-related charges. This compares to prior guidance of $480,000 and 21.2%.


- Japan’s August trade deficit JPY560 bln, as expected (last deficit of JPY600 bln). August Imports -17.8% yr/yr (expected -19.4%; last -13.6%) and Exports -0.8% yr/yr (expected -1.7%; last -0.3%)
- South Korea’s August PPI 0.9% m/m (last 0.3%); 1.0% yr/yr (last -0.3%)
- Australia’s August MI Leading Index 0.0% m/m (last 0.0%)
- New Zealand’s Q2 Current Account deficit 7.5% of GDP (last 8.5% of GDP)
- The People’s Bank of China made no changes to its one-year and five-year loan prime rates, as expected.
- China exported no gallium nor germanium in August, according to customs data.
- China’s Transport Ministry announced that international cruise arrivals and departures will be fully resumed.
- There was some speculation that the Reserve Bank of India intervened in the foreign exchange market to stop the rupee from continuing to a fresh record low against the dollar.
- Standard & Poor’s affirmed Australia’s AAA rating with a Stable outlook.
Equity indices in the Asia-Pacific region ended the midweek session on a lower note. China fell 0.5%, while Japan shed 0.7%. The Shanghai Composite seemed unimpressed by the PBOC’s decision to leave the lone prime rate status quo. A larger-than-expected trade deficit in Japan seemed to hinder the Nikkei on Wednesday.
- Japan’s Nikkei: -0.7%
- Hong Kong’s Hang Seng: -0.6%
- China’s Shanghai Composite: -0.5%
- India’s Sensex: -1.2%
- South Korea’s Kospi: +0.0%
- Australia’s ASX All Ordinaries: -0.5%
- Malaysia’s FKLCI: -0.4%
- Singapore’s STI: +0.0%

- Eurozone’s July Construction Output 0.8% m/m (last -1.2%)
- Germany’s August PPI 0.3% m/m (expected 0.2%; last -1.1%); -12.6% yr/yr, as expected (last -6.0%)
- U.K.’s August CPI 0.3% m/m (expected 0.7%; last -0.4%); 6.7% yr/yr (expected 7.0%; last 6.8%). Core CPI 0.1% m/m (expected 0.6%; last 0.3%); 6.2% yr/yr (expected 6.8%; last 6.9%) Input PPI 0.4% m/m (expected 0.2%; last -0.4%) and Output PPI 0.2% m/m (expected 0.1%; last 0.2%)
- There is growing speculation that the Bank of England will refrain from hiking again at tomorrow’s policy meeting after the release of cooler than expected inflation figures for August.
- European Central Bank policymaker Schnabel said that unit labor costs are the largest driver of domestic inflation while policymaker Panetta spoke in favor of countercyclical fiscal policy that would foster public investment.
Equity markets in Europe rose on Wednesday, with the German DAX up 0.7% and the benchmark Stoxx 600 adding 1% led by gains in auto stocks. On the economic data front, German producer prices plunged by 12.6% in August, the largest decline on record, due to falling energy prices. Additionally, the UK inflation rate unexpectedly slowed to 6.7%, the lowest since February 2022 and below the market consensus of 7.0%, raising questions about how much higher the Bank of England will raise interest rates, just a day before its September policy announcement. Meanwhile, the US central bank is widely expected to keep interest rates steady, but markets will be focused on its economic projections and Fed Chair Jerome Powell’s remarks after the meeting for clues about the path forward.
Equities in London extended early gains and closed 0.9% higher at 7,732 on Wednesday, supported by hopes of a more moderate policy outlook for the Bank of England after investors welcomed a sharp slowdown in price growth during August. Annual inflation in the UK unexpectedly fell to 6.7% and the core rate slowed to 6.2%. As a result, markets are now loosely split on a further rate rise by the Bank of England tomorrow, down from 80% of positions awaiting a 25bps hike before the release of the data. Sectors with exposure to interest rates benefited the most.
- U.K.’s FTSE 100: +0.9%
- Germany’s DAX: +0.8%
- France’s CAC 40: +0.7%
- Italy’s FTSE MIB: +1.6%
- Spain’s IBEX 35: +1.2%
- STOXX Europe 600: +0.9%

• • • • •

Thursday 21 September 2023.
The Stock Trader’s Almanac’s stats for the Benchmark Indices for Thursday of Week 38 over a 21-year average are;
- Dow Jones (DJIA): Mildly Bearish 52.4%
- S&P 500 (SPX): Quite Bearish 66.7%
- NASDAQ (COMP): Bearish 57.1%
![]()
The Pattern Trader™ Tools Screener stats for the Benchmark Index ETFs for Thursday of Week 38;
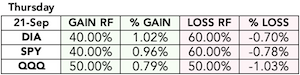
- SPDR DJIA ETF Trust (DIA – 19yr Avg): Bearish 60.00%
- SPDR S&P 500 ETF Trust (SPY – 19yr Avg): Bearish 60.00%
- Invesco QQQ Trust Series I (QQQ – 13yr Avg): Flat-to-Bearish 50.00%
Thursday 21 September
- Australia – CB Leading Index m/m, RBA Bulletin
- EU – Eurozone Consumer Confidence
- UK – Public Sector Net Borrowing, Monetary Policy Summary, MPC Official Bank Rate Votes, Official Bank Rate, BOE Inflation Letter
- US –
- Weekly Initial Claims
- Continuing Jobless Claims
- September Philadelphia Fed Index
- Q2 Current Account Balance
- August Existing Home Sales
- August Leading Indicators
- EIA Natural Gas Inventories

Summary Of Fed Chair’s Press Conference
~ Briefing.com ~
Market walks a lower line after Fed decision
Stocks weakened following the 2:00p.m. ET FOMC announcement and Fed Chair Powell’s 2:30 p.m. ET press conference. The impetus for the pullback isn’t because the Fed and Fed Chair Powell were decidedly hawkish. The impetus for the pullback is that the Fed and Fed Chair Powell are decidedly not dovish.
They are not thinking rate cuts. Rather, they are thinking more along the lines of how many additional rate hikes might be needed, and if the answer is none, how long they should stay at a restrictive level to ensure inflation is going to come back down to 2.0% on a sustainable basis.
This is the essence of what Fed Chair Powell meant when he said several times the Fed is going to “proceed carefully” when thinking about making a policy move. The Fed respects the history of lag effects when it comes to tightening cycles, yet it also appreciates that structural factors could be making this cycle different in terms of the timing of the transmission effect.
The Fed admittedly has been struck by the enduring strength of the economy, but with signs of loosening starting to appear in the labor market, and evidence building that low to middle-income consumers in particular are suffering from the weight of inflation, it wants to walk a careful line at this point with its policy decisions; however, a strong economy threatens to keep inflation at elevated levels that disproportionately hurt low to middle-income households, so if it takes higher rates to get inflation down to its 2.0% target on a sustainable basis, then the Fed will walk that line.

Done & Dusted
As with most September and October FOMC decisions, this one didn’t meet with the market’s approval. Now its over to the BoE and BoJ and a whole bunch of PMIs to see if those numbers can quell what I think is going to be a violent (I meant to type volatile) end to the week.

Copyright© 2023 FinancialScents Pte Ltd
~~~~~~~~~~~~~~~~~~~~~~~~~~~~~~~~~~~~

After 17 years of educating, mentoring and supporting hundreds of participants (annually) in the arts and sciences of Finance and Economics, the Pattern Trader™ Tutorial has evolved to become the most exclusive and sought-after boutique-styled mentorship that caters to retail individuals, institutional professionals, businesses and families that are serious about their finances and their prospects as we move into the future.
Enriching, Fulfilling, Life Changing
The personal mentorship and tutorial-styled approach delivers a conducive environment that allows for close communication and interaction between the mentor and the participant. The hands-on style makes the Tutorial very practical for anyone who requires a start from the ground up. It is the perfect beginning for anyone who wishes to take that first step in improving their financial and economic literacy.
If you’re looking to make a huge difference in your financial life and get the most value for your education investment, there’s no better choice than the time-tested and well reputed Pattern Trader™ Tutorial
Download our promo slides here: The Pattern Trader™ Tutorial

~~~~~~~~~~~~~~~~~~~~~~~~~~~~~~~~
Write to support@patterntrader.com for queries and further information.