August 2023 Volatile As Expected
Last year’s August went up and came down. This year, it went the other way. Technical levels played a huge part in how the benchmark indices rolled out the month as the 50DSMAs on the DJIA, SPX and COMP were tested. The RUT even tested its 200DSMA twice in the month.
From August’s MMO;
“The mega cap rally faltered somewhat in the middle of July but the broader market continued the rally with the help of the small-to-mid caps – usually a cautionary signal when bubble form amongst the larger caps – which gave the mega caps a timely “rest” before the next leg up. Fundamentally, the market is overbought with many of the mega caps exceeding their true values while the rest of the market plays catch up. Earnings have been an encouraging source of momentum for stocks. However on closer scrutiny, there really isn’t much to crow about. “
The mega-caps, especially the tech stocks, contributed to the slide in the first half of the month as much as they were responsible for the bounce back in the final week of the month … although it has to be said, without the kind of commitment that saw them rally in June and July.

Click to expand
“… the NASDAQ Composite Index (COMP) stalled out in the last three weeks, unable to break above 14,400 and looking likely to falter in a Double Top …“
And falter it did. Now, having successfully bounced off its (new) PhiB COP (61.8%) and re-entering its up trending channel, the tech-heavy index looks good enough for more upside in the coming weeks … if only volumes returned in force to make it sustainable.

This past week saw volumes fall off a cliff as the market made its relief rally – not an encouraging sign for the bulls as all – in what is likely to be unsustainable and most likely to top out again in September. Should that happen, it’s going to be a grand Double Top across all the four benchmark indices.
The Bulls’ Hit-&-Run
On the macro front, it was mentioned last month that;
“… this market is rallying on “not as bad as expected” news when the news really hasn’t been that great to justify this rally. The speculation of peak Fed Funds Rate has been one of the main reasons this market keeps pushing higher, totally missing the fact that the CPI, PCE and other inflationary data is hinting that 3% inflation (down from 4.1% the previous month) may just be an anomaly especially when you consider that core inflation is at 4.8% (down from 5.3% the previous month). This continued decline in the inflation number will be challenged by a gainfully employed America – a concern for the Fed – if spending is not controlled.“
That aforementioned rally faded in a hurry in August and the buying appetite ceased until the last week of the month. The bulls reappeared to rally the market up between 24 to 31 August on significantly lower average volumes and a general lack to continuity and/or sustainability as most of the buying was done on the speculation that the Fed may reconsider its tightening program based on “some” of the latest economic data. I reckon a lot of the buying were bargain hunters and dip buying “investors” out of FOMO and a basic lack of awareness regarding market and economic conditions.
Consumer-Related Concerns
From Week 35’s WMO;

Click to expand
In a commentary from Sunday 27 August’s WMO, it was mentioned that Consumer related issues were likely to be affected in the month months;
“Adding to the absence of leadership from the growth sectors like industrials, financials, homebuilders and materials, consumer related issues are likely to be the next concern for investors … Although not an immediate concern that will rock the mark yesterday, this will become another economic stress point in the coming months.“
Real, sustainable leadership is still an enigma in the market right now. Historically, the market tends to get extremely volatile (bearish) or extremely flat after a sustained period without leadership from the likes of Industrials, Financials, HomeBuilders, Consumer Discretionary, Transports and/or Retail. With September beckoning, it’s going to be very tricky for this market to navigate any sort of sustainable bounce without leadership from one or several of the aforementioned sectors.


Click to expand
The first thee weeks of August saw the bears continue where they left off in July, sending the benchmarks down before the dip-hunting buyers jumped in in the final week of the month to cut some of the MTD losses back. In spite of their best efforts, the month closed for the DJIA (-1.4%) while SPX was unchanged at +0.1% and COMP up 0.5%. The bears had the majority of the sessions, scoring a little more than 2-to-1 on average for the month.
Technically Speaking …

Click to expand
The bulls may have done just enough to garner some optimism going into September by staying above its 50DSMA and registering green histograms for the first time in more than four weeks. Having said that, I’m seeing some MACD Divergence as the current high price is lower than the previous high price while the current histograms are higher than the histograms of the previous high price around 17 July.
About that P2P Divergence …

A quick word on that price-to-price divergence between the benchmark indices – it’s still there but it didn’t get much worse in August only because the month was mostly down and buyers weren’t interested in the mega-cap tech usuals because they tanked.
- Nasdaq Composite: +34.1% YTD
- S&P 500: +17.4% YTD
- Russell 2000: +8.9% YTD
- Dow Jones Industrial Average: +4.8% YTD
IYC Still …

The key inversions on the yield curve still persist with the 10-year/Fed Funds Rate inversion two sessions shy of 200 days – something not seen since Sub-Prime. The inverted 3m/10y spread that began on 25 October, is now two hundred and fourteen sessions old, making it the longest inversion in 42 years and the current inversion of the 2y/10y which began on Tuesday 5 July 2022 is now two-hundred and ninety-three sessions old, making it the longest period of inversion in 42 years.
Bond yields as of the close of 31 August 2023;
- 3-mth: 5.56% (+1 bp for the month)
- 2-yr: 4.85% (-3 bps for the month)
- 5-yr: 4.23% (+5 bps for the month)
- 10-yr: 4.09% (+12 bps for the month)
- 30-yr: 4.20% (+18 bps for the month)
Historical stats are 50%/50% …

Click to expand
Out of the 23 sessions in August (yes, it was a damn long month!) 13 sessions were totally divergent from the historical statistics from the Stock Trader’s Almanac’s 21-year averages on the benchmark indices. Against our Stock Screener, 12 sessions were totally divergent from the index ETFs’ performance. Such is the nature of August which is why its historical stats are always flattish and uneventful.
• • • • •

OUTLOOK FOR SEPTEMBER 2023

SEPTEMBER is historically the most bearish of the trading calendar. The Stock Trader’s Almanac ranks it 12th of out 12 months on the DJIA, SPX, COMP, RUT and RUI.
SEPTEMBER TRIVIA
- September is the third and final month of Quarter Three
- The month of September 2023 has 20 trading sessions and one public holidays, which is the second shortest trading session for the year after February and April.
- September is DOW’s and S&P’s fifth month of its “six volatile months”.
- It is also NASDAQ’s third month of its “worst four months”.
- September has been the biggest loser on the DJIA, SPX and COMP since 1950.
- The final week of September usually sees Window Dressing and on the occasion, Portfolio Dumping (See “Education”).
Based on a 21-year average on the Benchmark Indices (DJIA, SPX & COMP) according to the Stock Trader’s Almanac;

Click to expand
- Week 35 (28 August to 01 September) has the most bullish session (Tue 29) of the year but is otherwise quite volatile.
- Week 36 (04 to 08 September) is often flat and uneventful.
- Week 37 (11 to 15 September) is mostly bullish.
- Week 38 (18 to 22 September) starts very bullish but immediately becomes bearish and ends very bearish.
- Week 39 (25 to 29 September) is mostly flat with mild swings.
Some interesting statistics for September;
- First trading day in September (Friday 01) has been down on the SPX 9 of the last 14 (last year up).
- The first week of September tends to be flat and uneventful.
- Monday 04 September – Market Closed in observance of Labour Day.
- The day after Labour Day (Tuesday 05) has been up on DJIA 16 of the last 28, but down 9 of the last 12 (last year down).
- The second week of September is more bullish than bearish.
- Monday of September Triple Witching Week has been down on COMP 14 of the last 23 (last year up).
- September Triple Witching Friday has been up on DJIA 11 of the last 18 but down 7 of the last 10 (last year down).
- Friday 22 September is the fifth-most bearish session of the year.
- The third week of September is the month’s most bearish week.
- The week after September Triple Witching Week (Week 38) has been down on DJIA 24 of the last 32 (last year down).
- Monday 18 September is the year’s third most bullish session .
- Wednesday 20 September – FOMC Monetary Policy Decision at 2:00pm ET
- The final week of September is prone to swings and ends poorly.
- The final week of September is also the end of Q3 and is prone to Portfolio Reconstitution/Restructuring by institutions.
- The last trading day in September has been down on SPX 16 of the last 25 but up 5 of the last 7 (last year down).
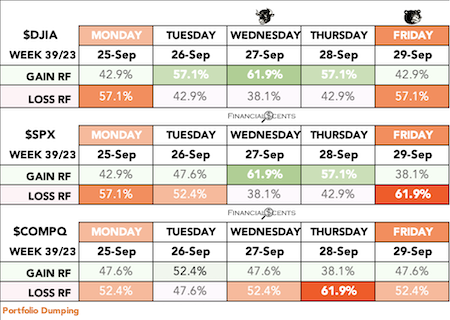
In the last two years …
The tables below are how September performed in the last two years;


As you look at the last two years’ performance, remember that 2021 was a bearish year. September of 2022 was more accurate in how the month usually behaves with the second half of the month being dominated by the bears.


SEPTEMBER is the third month of the third quarter and the fifth month of “The Six Volatile Months” on the S&P 500 and Dow Jones Industrial Average. It is also the third month of the “The Worst Four Months” for the NASDAQ Composite.
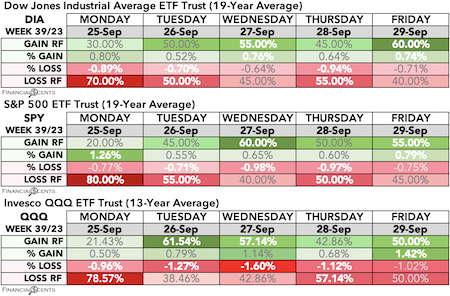
Unlike the benchmark indices, the benchmark index ETFs (DIA, SPY and QQQ) are not as bearish in September when compared to June and January – in that order – over 19 years’ averages on DIA and SPY and 13 years on QQQ (Not to be confused with the percentages of the benchmark indices DJIA, SPX and COMP over 21-year averages).
This is the Daily September Table from our Seasonal Screener for the benchmark indices’ ETFs, DIA, SPY and QQQ.

Click to expand
Like the stats from the Stock Trader’s Almanac, our Seasonal Screener also reveals that the index ETFs for the benchmarks are also flat-to-bullish in the first week of the month, gets bullish in the second week and loses steam in the second half of the month.
- Week 35 (28 August to 01 September) starts bearish, gets extremely bullish midweek and ends bearish.
- Week 36 (04 to 08 September) is mostly bearish.
- Week 37 (11 to 15 September) is mostly bullish.
- Week 38 (18 to 22 September) is more bearish than bullish with an upswing on Tuesday.
- Week 39 (25 to 29 September) tends to be flat with slightly volatile swings.
 For September over the last 19 years, DIA carries a 50.00%GRF/50.00%LRF with an average gain of +2.75%Gain but greater average losses at -3.37%Loss. September is the worst month for DIA gains.
QQQ carries a massive 35.71%GRF/64.29%LRF over the last 13 years. It comes with a lower average gain of +2.22% than its downside potential of -3.92%. September is the tech-heavy ETF’s only month bearing losses.
SPY is bullish at 55.00%GRF/45.00%LRF over its last 19 years for an average gain of +2.35% while carrying a higher average losses of -4.89%.
Get the daily statistics with our Daily Market Analysis posted here everyday.
 September has ten of the thirteen ETFs featured in our free Seasonal Screener with %LRFs at 50% or more, accompanied by higher %Losses. That’s the second highest number of bearish ETFs in the year after June (11).
Another measure of September’s bearishness is ten of the thirteen ETFs have greater %Losses than %Gains regardless of their %RFs. And the %Gains in August are also very limited, in other words, not worth the risk of going long.
The best performers don’t go higher than Energy (XLE) at 60.00%GRF in September. However, it carries a massively higher risk at -9.93%Loss than its average potential +5.48%Gain.
The next best bets are no different in that they carry higher risk than reward. Industrials (XLI) and Technology (IYW) are both at 55.00%GRF. XLI’s risk is -5.34%Loss and IYW is -5.49%Loss while carrying lower rewards at +3.69%Gain and +3.21%Gain (over 19 years).
 The most bearish sector is Consumer Staples (XLP) at 60.00%LRF with an average -2.48%Loss which is slightly higher than its average gain of +2.00% over the last 19 years.
Retail (XRT) and Homebuilders (XHB) are the next two most-bearish sectors at 58.82%LRF, both with average %Losses that outpace their average %Gains.
XRT’s average risk is a whopping -9.39%Loss versus an average +7.45%Gain while XHB’s average risk is at -6.75%Loss versus an average +5.65%Gain over the last 17 years.
 Energy (XLE), is the month’s biggest loser with a -9.93%Loss, while at the same time, it is also the month’s third best rewarding with a +5.48%%Gain at 60.00%GRF.
The month’s next worst loser is Retail (XRT) at -9.39%Loss but it also carries the best potential return of +7.45%Gain.
Homebuilders (XHB) offer the second best reward at +5.65%Gain but its risk is higher at -6.75%Loss.
Basic Materials (XLB) carries the third highest risk after XLE and XRT, offering a –7.00%LRF compared to its +3.47%GRF.
SUMMARY
From last month’s MMO;
“I used to dread September (my former bogey month) until I learnt the power of hedging. These years, I yearn for Quarter Three because it is a substantial period for my annual income.“
Knowing the market’s annual cycle has been one of the best defensive strategies that I’ve come to rely on over the last decade. Does it always works? Like everything else in life, not really. But it is better than going into the market blind and depending on hope. Obviously, it’s not just historical statistics that make up this defensive strategy. It is a blend of macroeconomics, historical price action, technical analysis and a complete overview of the various moving parts of the financial system that makes everything come together.
Now if only we had a crystal ball to tell us what’s coming in the realm of the unexpected … wouldn’t that be a sight to behold!

Check out the full table of ETFs at our FREE Seasonal Summary Table at Patterntrader.com and join our Pattern Trader Tools discussion page on Facebook.

The Games Fund Managers Play
Window dressing is a strategy used by mutual fund and other portfolio managers to improve the appearance of a fund’s performance before presenting it to clients or shareholders. To window dress, the fund manager sells stocks with large losses and purchases high-flying stocks near the end of the quarter or year.
Portfolio Pumping, also known as “Painting The Tape”, is the practice of artificially inflating portfolio performance. It is typically done by purchasing large amounts of shares in existing positions, shortly before the end of the reporting period. Public awareness of portfolio pumping has been increased by a series of influential academic articles, and the practice is now more tightly monitored by securities regulators.
- Portfolio pumping began garnering widespread attention following the publication of an article in 2002, entitled “Leaning for the Tape: Evidence of Gaming Behavior in Equity Mutual Funds.” This article, which was published in The Journal of Finance, provided clear evidence that portfolio pumping is a widespread phenomenon.
- Following this research, the SEC and other regulators increased their oversight of portfolio pumping. However, there is reason to believe that the phenomenon continues to this day.
- Today, unethical investment managers can also use high-frequency trading (HFT) technologies amongst dark pools to perpetrate portfolio pumping schemes.
Portfolio Dumping is the process of selling struggling securities that have been a drag on the overall performance of a portfolio. On paper, the portfolio will have a better past performance with the absence of these dragging securities.
Pump-&-Dump schemes were traditionally conducted through cold calling. The advent of the Internet has shifted most of this activity online; fraudsters can now blast hundreds of thousands of email messages to unsuspecting targets or post messages online enticing investors to buy a stock quickly.
- Pump-and-dump is an illegal scheme to boost a stock’s or security’s price based on false, misleading, or greatly exaggerated statements.
- Pump-and-dump schemes usually target micro- and small-cap stocks.
- People found guilty of running pump-and-dump schemes are subject to heavy fines.
- Pump-and-dump schemes are increasingly found in the cryptocurrency industry.
- The same scheme can be perpetrated by anyone with access to an online trading account and the ability to convince other investors to buy a stock that is supposedly “ready to take off.” The schemer can get the action going by buying heavily into a stock that trades on low volume, which usually pumps up the price.
Summary
Read up on our Daily, Weekly and Monthly reports to get ahead of the market instead of lagging behind the curve by reading endless reports about what has already happened. Understand the nature of Market Cycles, Sector Rotation, Interest Rates, Earnings and learn how to turn all that information into cash. And if you don’t get it, you should seriously consider the Pattern Trader™ Tutorial. 😎


Benchmark Indices ($DJIA, SPX AND COMP 21-year average)
- Week 35 (28 August to 01 September) has the most bullish session (Tue 29) of the year but is otherwise quite volatile.
- Tuesday 29 August is the most bullish session of the year.
- The third-to-last trading day (Tuesday 29) has been up on SPX 19 years in a row between 2003 and 2021 (last year down).
- The second-last trading day (Wednesday 30) has been down on SPX 17 of the last 26 (last year down).
- The last trading day in August has been up on SPX 9 of the last 14 (last year down).
- The first trading day of September has been down on SPX 9 of the last 14.

Benchmark Index ETFs (DIA, SPY 19-Year Average & QQQ 13-Year Average):
- Week 35 (28 August to 01 September) starts bearish, gets extremely bullish midweek and ends bearish.

Week 35 Key U.S. Economic Notes:
- Monday 28 August – Nothing of note
- Tuesday 29 August – FHFA Housing Price Index, S&P Case-Shiller Home Price Index, Consumer Confidence, JOLTS – Job Openings
- Wednesday 30 August – MBA Mortgage Applications Index, ADP Employment Change, Adv. Intl. Trade in Goods, GDP – Second Estimate, GDP Deflator – Second Estimate, Pending Home Sales, EIA Crude Oil Inventories
- Thursday 31 August – Initial Claims, Continuing Claims, Chicago PMI, PCE Prices, Core PCE Prices, Personal Income, Personal Spending, Natural Gas Inventories
- Friday 01 September – Average Workweek, Hourly Earnings, Non-Farm Payrolls, Non-Farm Private Payrolls, Unemployment Rate, Construction Spending, ISM Manufacturing Index
• • • • •

Benchmark Indices ($DJIA, SPX AND COMP 21-year average)
- Week 36 (04 to 08 September) is often flat and uneventful.
- Monday 04 September – Market Closed in observance of Labour Day.
- The day after Labour Day (Tuesday 05) has been up on DJIA 16 of the last 28, but down 9 of the last 12 (last year down).

Benchmark Index ETFs (DIA, SPY 19-Year Average & QQQ 13-Year Average):
- Week 36 (04 to 08 September) is mostly bearish.

Week 36 Key U.S. Economic Notes:
- Monday 04 September – Market closed in observance of Labour Day
- Tuesday 05 September – Factory Orders
- Wednesday 06 September – MBA Mortgage Applications Index, Trade balance, ISM Non-Manufacturing Index, Fed’s Beige Book
- Thursday 07 September – Initial Claims, Continuing Claims, Productivity-Rev, Unit Labour Costs-Rev, Natural Gas Inventories, EIA Crude Oil Inventories
- Friday 08 September – Wholesale Inventories, Consumer Credit
• • • • •

Benchmark Indices ($DJIA, SPX AND COMP 21-year average)
- Week 37 (11 to 15 September) is mostly bullish.
- The second week of September is more bullish than bearish.
- Monday of September Triple Witching Week has been down on COMP 14 of the last 23 (last year up).
- September Triple Witching Friday has been up on DJIA 11 of the last 18 but down 7 of the last 10 (last year down).

Benchmark Index ETFs (DIA, SPY 19-Year Average & QQQ 13-Year Average):
- Week 37 (11 to 15 September) is mostly bullish.

Week 37 Key U.S. Economic Notes:
- Monday 11 September – Nothing of note
- Tuesday 12 September – WASDE August Report
- Wednesday 13 September – MBA Mortgage Applications Index, CPI, Core CPI, EIA Crude Oil Inventories, Treasury Budget
- Thursday 14 September – Initial Claims, Continuing Claims, PPI, Core PPI, Retail Sales, Retail Sales ex-Auto, Business Inventories, Natural Gas Inventories
- Friday 15 September – Empire State Manufacturing Index, Export Prices ex-Ag, Import Prices ex-Oil, Capacity Utilisation, Industrial Production, UoM Consumer Sentiment-Prelim
• • • • •

Benchmark Indices ($DJIA, SPX AND COMP 21-year average)
- Week 38 (18 to 22 September) starts very bullish but immediately becomes bearish and ends very bearish.
- The third week of September is the month’s most bearish week.
- The week after September Triple Witching Week (Week 38) has been down on DJIA 24 of the last 32 (last year down).
- Monday 18 September is the year’s third most bullish session .
- Wednesday 20 September – FOMC Monetary Policy Decision at 2:00pm ET
- Friday 22 September is the fifth-most bearish session of the year.

Benchmark Index ETFs (DIA, SPY 19-Year Average & QQQ 13-Year Average):
- Week 38 (18 to 22 September) is more bearish than bullish with an upswing on Tuesday.

Week 38 Key U.S. Economic Notes:
- Monday 18 September – NAHB Housing Market Index, Net Long-Term TIC Flows
- Tuesday 19 September – Building Permits, Housing Starts
- Wednesday 20 September – MBA Mortgage Applications Index, EIA Crude Oil Inventories, FOMC Rate Decision
- Thursday 21 September – Initial Claims, Continuing Claims, Current Account Balance, Philadelphia Fed Index, Existing Home Sales, Leading Indicators, Natural Gas Inventories
- Friday 22 September – Nothing of note.
• • • • •

Benchmark Indices ($DJIA, SPX AND COMP 21-year average)
- Week 39 (25 to 29 September) is mostly flat with mild swings.
- The final week of September is prone to swings and ends poorly.
- The final week of September is also the end of Q3 and is prone to Portfolio Restructuring by institutions.
- The last trading day in September has been down on SPX 16 of the last 25 but up 5 of the last 7 (last year down).
Benchmark Index ETFs (DIA, SPY 19-Year Average & QQQ 13-Year Average):
- Week 39 (25 to 29 September) tends to be flat with slightly volatile swings.
Week 39 Key U.S. Economic Notes:
- Monday 25 September – Nothing of note
- Tuesday 26 September – FHFA Housing Price Index, S&P Case-Shiller Home Price Index, Consumer Confidence, New Home Sales,
- Wednesday 27 September – MBA Mortgage Applications Index, Durable Goods, Durable Goods –ex transportation, EIA Crude Oil Inventories
- Thursday 28 September – Initial Claims, Continuing Claims, GDP – Third Estimate, GDP Deflator – Third Estimate, Pending Home Sales, Natural Gas Inventories
- Friday 29 September – Adv. Intl. Trade in Goods, Chicago PMI, PCE Prices, PCE Prices – Core, Personal Income, Personal Spending, UoM Consumer Sentiment – Final

• • • • •

The Metal Meets The Meat
From August’s MMO;
“This four-and-a-half month old rally is looking very tired and obviously running out of steam as we get into the bearish months of quarter three … I am not expecting a major breakout … unless we’re talking about a break-down. Now that’s something I’d put money on over the next ten weeks.“
That correction seems done and dusted with the past week bouncing back in irrepressible form (even if it was on lower average volumes). However, if there is no follow through to break to a higher high, then this will end up being a lower high which the bears are very likely to take to a lower low in September. Then there’s the possibility of inflation rising in August based on the spike in the PPI last month which is why the Fed and Powell have stood pat on their policies till the end of the year. The market will be anxious until the 20th of September when the Fed makes its latest decision on monetary policy. Expect volatility to continue ruling the market and discount the bears at your own risk.
Happy Hunting!

Copyright© 2023 FinancialScents Pte Ltd
~~~~~~~~~~~~~~~~~~~~~~~~~~~~~~~~~~~~

After 17 years of educating, mentoring and supporting hundreds of participants (annually) in the arts and sciences of Finance and Economics, the Pattern Trader™ Tutorial has evolved to become the most exclusive and sought-after boutique-styled class that caters to retail individuals, institutional professionals, businesses and families that are serious about their finances and their prospects as we move into the future.
Enriching, Fulfilling, Life Changing
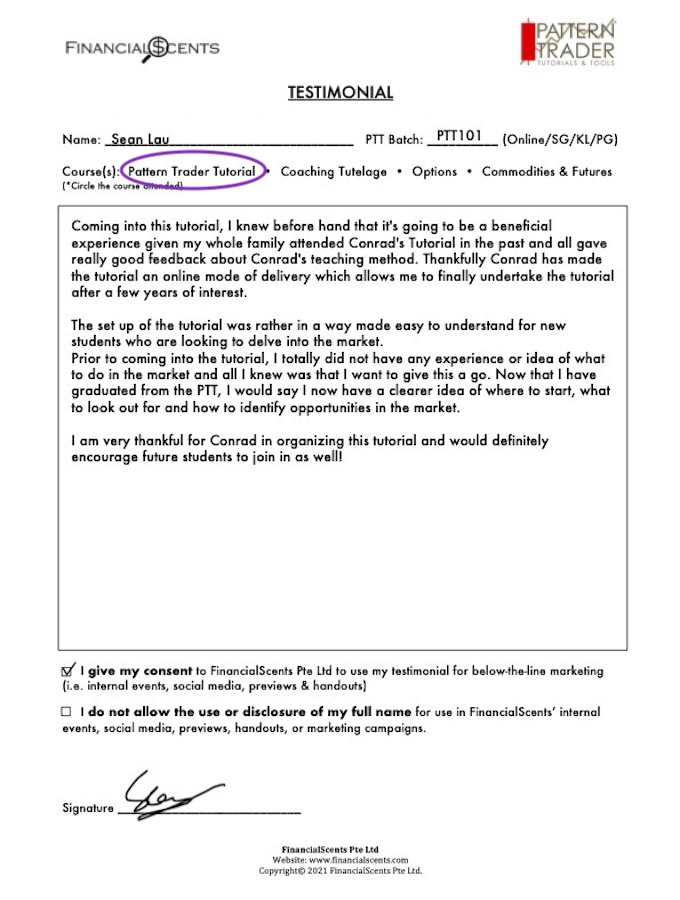
The personal mentorship and tutorial-styled approach delivers a conducive environment that allows for close communication and interaction between the mentor and the participant. The hands-on style makes the Tutorial very practical for anyone who requires a start from the ground up. It is the perfect beginning for anyone who wishes to take that first step in improving their financial and economic literacy.
If you’re looking to make a huge difference in your financial life and get the most value for your education investment, there’s no better choice than the time-tested and well reputed Pattern Trader™ Tutorial
Download our promo slides here: The Pattern Trader™ Tutorial

~~~~~~~~~~~~~~~~~~~~~~~~~~~~~~~~
Write to support@patterntrader.com for queries and further information.