
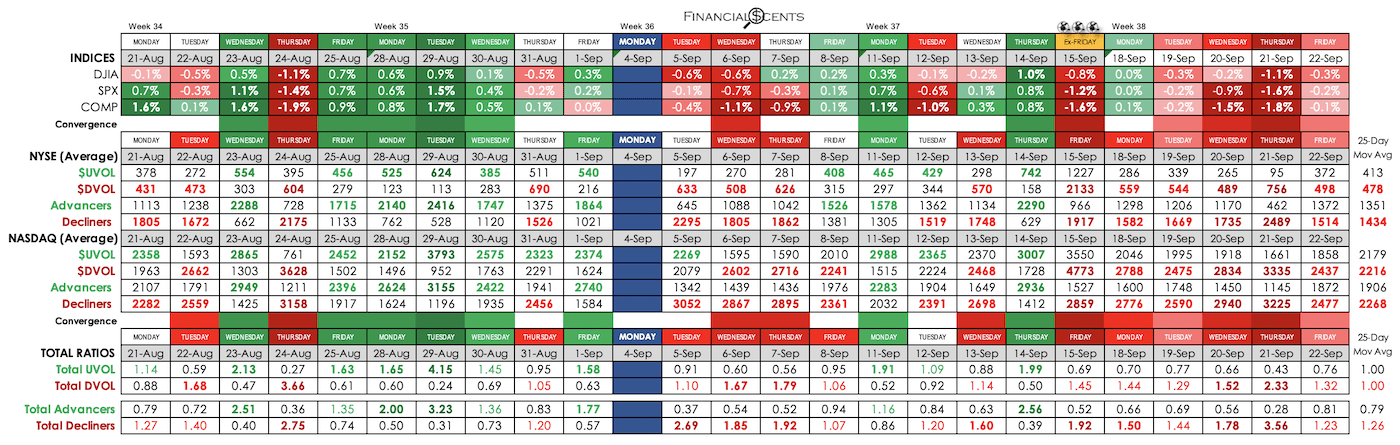
MONDAY 18 TO 22 SEPTEMBER 2023
(Excerpts from Briefing.com, tradingeconomics.com, marketwatch.com, CNBC )
Dow And Nasdaq Down For Three Week, S&P For Four
The major indices registered sizable declines this week. Softness in mega caps had a disproportionate influence on index performance, but there was no effort to rotate anywhere else so many stocks came along for the downside ride.
All 11 S&P 500 sectors finished in the red this week. The consumer discretionary (-6.4%), real estate (-5.4%), and materials (-3.7%) were the top laggards while the health care sector (-1.2%) saw the slimmest loss.
The catalyst for the weakness was another big jump in Treasury yields. The 2-yr note yield climbed eight basis points this week to 5.10%. The 10-yr note yield climbed 11 basis points this week to 4.44%. Including this week’s move, the 10-yr note yield is up 35 basis points this month.
Those moves were largely in response to the Fed’s hawkish pause on Wednesday.
As expected, the FOMC voted unanimously to leave the target range for the fed funds rate unchanged at 5.25-5.50%. There were few changes to the directive itself, but the market was focused on the Summary of Economic Projections and dot plot, which conveyed two key takeaways: (1) Policy rates are anticipated to remain higher for longer and (2) Fed officials are not expecting to cut rates in 2024 as much as they were anticipating when they updated their forecasts in June.
The median fed funds rate estimate for 2023 was unchanged at 5.6%, but the median estimate for 2024 was 5.1%, versus 4.6% in June. The former estimate suggests officials are still leaning in favor of one more rate hike this year, whereas the latter revision connotes an expectation that rates will come down by only 50 basis points in 2024, as opposed to 100 basis points when estimates were provided in June. Meanwhile, the median estimate for 2025 was 3.9% versus 3.4% in June, and a median estimate of 2.9% was introduced for 2026. The longer-run fed funds rate estimate was maintained at 2.5%, leaving one to infer that the Fed is going to stay committed to its 2.0% inflation target.
Fed Chair Powell said several times at his press conference that the Fed is going to “proceed carefully” when thinking about making a policy move, but said it’s plausible that the neutral rate is higher than the longer run rate (2.5%), which he said is part of the explanation for why the economy has been more resilient than expected.
The wrinkle for the market wasn’t that the Fed is decidedly hawkish at this point, it was that the Fed is still not dovish.
More Fed officials echoed Mr. Powell’s view later in the week, Specifically, San Francisco Fed President Daly (a 2024 FOMC voter), Fed Governor Bowman (FOMC voter), and Boston Fed President Collins (not an FOMC voter this year or 2024) all made similar comments on Friday.
Other central banks also made policy announcements this week. The Bank of England voted 5-4 to leave its bank rate unchanged at 5.25%; the Hong Kong Monetary Authority left its key rate unchanged at 5.75%; the Swiss National Bank left its key rate unchanged at 1.75%; the Bank of Japan made no changes to its policy stance; the Riksbank increased its key rate by 25 basis points to 4.00%; and the Norges Bank increased its key rate by 25 basis points to 4.25%.
In corporate news, there were two notable initial public offerings this week. Instacart (CART) and Klaviyo (KVYO) both traded above their IPO price after opening, but rolled over with the rest of the market by the end of the week.
The UAW extended its strike to all GM and STLA parts and distribution centers beginning at noon ET on Friday. This followed confirmation that the UAW made progress on labor talks with Ford (F), but indicated that Stellantis (STLA) and General Motors (GM) are going to need “serious pushing.”
Monday:
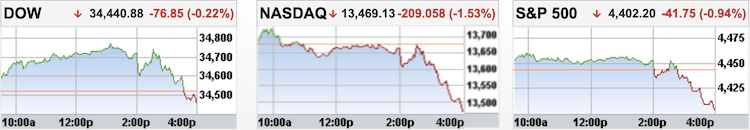
The stock market had a mixed showing following Friday’s sell-off. The major indices settled flat after pulling back from their highs of the day, following the trend of the mega cap stocks. The Russell 2000 was relatively weak, falling 0.7%.
The lack of conviction was driven by some hesitation ahead of the FOMC meeting on Wednesday.
Apple (AAPL) was a source of support for the major indices after reacting favorably to comments from analysts.
Ford (F), General Motors (GM), and Stellantis (STLA) were standout laggards after the UAW rejected a Stellantis offer to increase pay by nearly 21% over the contract term, with a 10% immediate increase.
Monday’s economic data was limited to the NAHB Housing Market Index, which dropped to 45 in September (consensus 50) from 50 in August.
Tuesday:
The major indices ended the day in negative territory, but closed well off their lows of the day, paced by the ebb and flow of the mega cap stocks. The Vanguard Mega Cap Growth ETF (MGK) had been down 1.0% at its low before closing with a 0.2% loss. Other stocks, however, also improved in the afternoon trade.
An intraday pullback in crude oil, which topped $92.00/bbl earlier in the session, aided the afternoon recovery effort. WTI crude oil futures settled 0.04% lower at $90.49/bbl.
The overall negative bias was partially driven by hesitation in front of Wednesday’s FOMC announcement, which will also feature an updated Summary of Economic Projections and dot plot.
Rising market rates acted as another headwind.
Instacart (CART) was an individual stock standout. The company priced its IPO at $30/share on Monday night, opened for trading at $42, but gave back a big chunk of that opening gain.
Tuesday’s economic data was limited to housing starts, which hit their lowest level in August (1.283 million) since June 2020, and building permits – a leading indicator – which were up 6.9% month-over-month to a stronger-than-expected 1.543 million with permits for single units up 2.0%.
Wednesday:
The stock market started the session with a positive bias as participants waited for the 2:00 p.m. ET release of the FOMC decision. The early upside moves were supported by falling oil prices and market rates. The Nasdaq had a modest loss in the early going, due to lagging mega caps, but the A-D line was positive and the other major indices were in the green.
Both the stock and bond market experienced volatile price action following the September FOMC Statement. As expected, the FOMC voted unanimously to leave the target range for the fed funds rate unchanged at 5.25-5.50%. There were few changes to the directive itself, but the market was focused on the Summary of Economic Projections and dot plot, which conveyed two key takeaways: (1) Policy rates are anticipated to remain higher for longer and (2) Fed officials are not expecting to cut rates in 2024 as much as they were anticipating when they updated their forecasts in June.
The turbulent price action continued as Fed Chair Powell gave his press conference. Mr. Powell said several times that the Fed is going to “proceed carefully” when thinking about making a policy move, but said it’s plausible that the neutral rate is higher than the longer run rate (2.5%), which he said is part of the explanation for why the economy has been more resilient than expected.
The wrinkle for the market wasn’t that the Fed is decidedly hawkish at this point, it was that the Fed is still not dovish.
Stock settled into a steady decline in the late afternoon, led by the mega caps, that left the S&P 500 just above the 4,400 level.
Klaviyo (KVYO), which priced its IPO at $30, traded as high as $37 before pulling back with the rest of the market in the afternoon trade.
Reviewing Wednesday’s economic data:
- The weekly MBA Mortgage Applications Index rose 5.4% with refinance applications jumping 13.0% and purchase applications increasing 2.0%.
- The weekly EIA crude oil inventories showed a draw of 2.14 million barrels versus last week’s build of 3.96 million barrels.
Thursday:
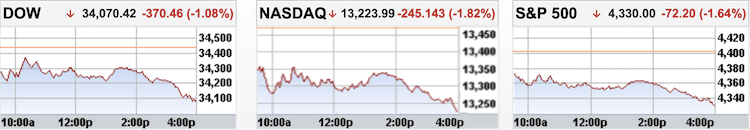
The stock market had a downtrend day. The major indices were under pressure from the start, but faded to session lows in the late afternoon trade. The indices ultimately closed near those levels with losses ranging from 1.1% to 1.8%. The S&P 500, which closed just above 4,400 on Wednesday, spent the whole session below that level on Thursday.
The biggest factor driving the weakness was the bump in market rates that started Wednesday afternoon in response to the Fed’s hawkish hold.
Losses were broad based, led by the mega caps and growth stocks. The Vanguard Mega Cap Growth ETF (MGK) fell 2.0% and the Russell 3000 Growth Index fell 1.9%.
There were some standout winners that had specific catalysts to account for the relative strength on this otherwise downbeat day.
Paramount Global (PARA), Warner Bros. Discovery (WBD), and FOX Corp. (FOXA) logged gains after CNBC reported that a resolution to the Hollywood writers’ strike may be reached soon.
Splunk (SPLK) was another top performer after news that it’s being acquired by Cisco (CSCO) for $28 billion, or $157.00 per share, in cash.
Reviewing Thursday’s economic data:
- Weekly Initial Claims 201K (consensus 225K); Prior was revised to 221K from 220K; Weekly Continuing Claims 1.662 mln; Prior was revised to 1.683 mln from 1.688 mln
- The key takeaway from the report is that the low level of initial claims shows that the labor market is still operating in a tight mode, which is going to remain a basis for the Fed to keep operating with a restrictive interest rate mindset.
- September Philadelphia Fed Index -13.5 (consensus -2.0); Prior 12.0
- Q2 Current Account Balance -$212.1 bln (consensus -$222.0 bln); Prior was revised to -$214.5 bln from -$219.3 bln
- August Existing Home Sales 4.04 mln (consensus 4.10 mln); Prior 4.07 mln
- The key takeaway from the report is that existing home sales continue to be crimped by a confluence of factors: higher mortgage rates and higher prices that are hurting affordability; limited supply; a lack of mobility due to remote work opportunities; and disinterest in moving by existing homeowners who are reluctant to give up a low-rate mortgage for a higher-rate mortgage.
- August Leading Indicators -0.4% (consensus -0.4%); Prior was revised to -0.3% from -0.4%
Friday:
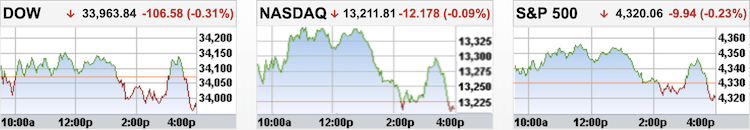
Friday’s trade started on a upbeat note with the major indices all showing modest gains following this week’s sell-off. The early positive bias was due in part to a buy-the-dip mentality, which was supported by the price action in the Treasury market.
The market started to decline coming out of the New York lunch hour. Downside moves were interrupted by a brief rebound effort, but the major indices ultimately settled near their lows of the day. The deterioration was attributed to San Francisco Fed President Daly (a 2024 FOMC voter), who reportedly echoed the new party line that the Fed may have some more tightening to do.
It is notable, however, that the 2-yr note yield, which is more sensitive to changes in the fed funds rate, didn’t react much to Ms. Daly’s acknowledgment. Technical factors may have played a bigger role in the afternoon slide after the S&P 500 was unable to clear initial resistance at 4,361, reaching a high of 4,357 on Friday.
The UAW confirmed reports that progress has been made on labor talks with Ford (F), but indicated that Stellantis (STLA) and General Motors (GM) are going to need “serious pushing.” Consequently, the UAW extended its strike to all GM and STLA parts and distribution centers beginning at noon ET.
Friday’s economic calendar featured the preliminary September S&P Global US Manufacturing PMI, which improved from August (actual 48.9; prior 47.9), but was still indicative of contraction (i.e. below-50 reading). The S&P Global US Services PMI, meanwhile, still reflected expansion, but fell to 50.2 in the preliminary September reading from 50.5 in August.
![]()
- Dow Jones Industrial Average: -1.9% for the week / +2.5% YTD
- S&P 500: -2.9% for the week / +12.5% YTD
- Nasdaq Composite: -3.6% for the week / +26.2% YTD
- Russell 2000: -3.8% for the week / +0.9% YTD
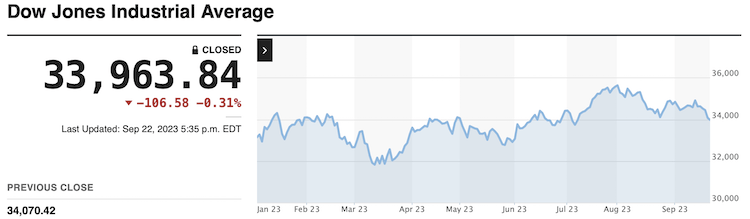
Post-FOMC Losses Trimmed
U.S. Treasuries ended Friday with gains across the curve, reclaiming some of their losses that were recorded after the FOMC reinforced the message that rates are expected to remain higher for longer. Shorter tenors led the market higher out of the gate after a night that saw the release of flash Manufacturing and Services PMI readings from major economies. Most of these readings pointed to ongoing contractions in both categories, with some scant exceptions like Services readings from Australia (50.5), Japan (53.3), and the U.S. (50.2). Treasuries rallied past their opening levels after the release of the flash PMI readings for the U.S., with 5s and longer tenors holding the bulk of their gains into the close while the 2-yr note backed off its morning high, but still recorded a solid gain. The market saw no meaningful shift in rate hike expectations even though Fed Governor Bowman (FOMC voter) said that she thinks that additional rate hikes will be appropriate while Boston Fed President (non-voter) Collins also said that additional tightening is still on the table. San Francisco Fed President Daly echoed the sentiment, though she is not an FOMC voter this year, but will be on next year’s Committee. Even with today’s advance, yields finished at fresh weekly highs for the year, and this week’s action narrowed the 2/10 spread by three basis points to -66 bps.
Bond Yields after the close on Friday 22 September:
- 3-mth: -1 bp at 5.56% (unchanged for the week)
- 2-yr: -2 bps to 5.10% (+8 bps for the week)
- 5-yr: -4 bps to 4.57% (+12 bps for the week)
- 10-yr: -5 bps to 4.44% (+11 bps for the week)
- 30-yr: -4 bps 4.53% (+11 bps for the week)
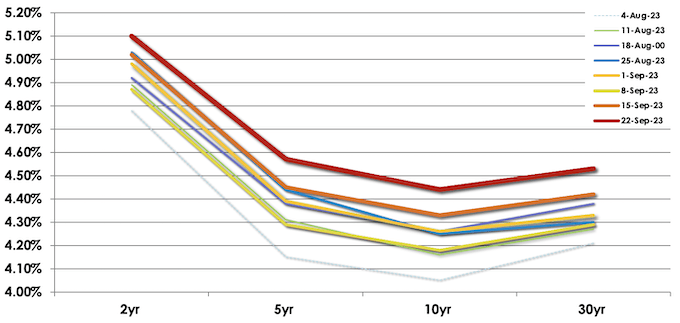
The yield curve rose in Week 38 with the long-term maturity yields rising more than its short-term counterparts to flatten the key inversions.
10-YEAR/2-YEAR
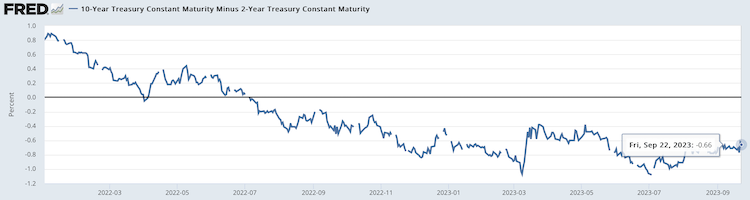
The inverted 2-year/10-year yield spread narrowed to -66 bps from -69 bps the previous week on Friday 15 September 2023.
- The current inversion of the 2/10 which began on Tuesday 5 July 2022 is now three-hundred and eight sessions old, making it the longest period of inversion in more than 45 years.
- The current inverted 2y/10y spread at -107 bps, printed on Wednesday 08 March 2023, surpassed the previous widest spread printed on Tuesday 07 March 2023 at -103 bps.
- One needs to go back all the way to October 1981 to see a steeper inversion than the current one.
The inversion of the 2/10 spread has heralded economic recessions/slow-downs, six months to a year ahead of almost every historical recession.
10-YEAR/3-MONTH
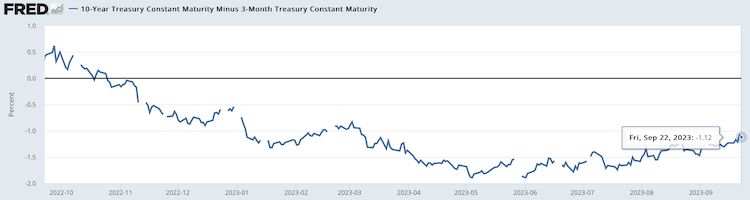
The inverted 3-month/10-year yield spread narrowed to -112 bps from -123 bps the previous week.
- The inverted 3m/10y spread that began on 25 October, is now two hundred and twenty-nine sessions old, making it the longest inversion more than 45 years.
- -189 bps printed on Thursday 01 June and Thursday 04 May is the widest inverted spread on the 3m/10y, surpassing the -188 bps printed on Wednesday 01 June and Wednesday 03 May 2023.
- -189 bps surpasses all the previous inverted 3m/10y spreads over the past 50+ years.
Historically, when the 3-month maturity yields more than the 10-year maturity with a minimum holding period of 10 straight days, a recession followed 6 to 18 months later with most of those recessions being Hard Landings.
10-YEAR/FED FUNDS RATE
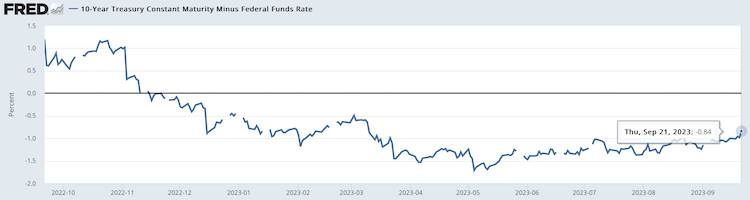
The inverted 10-year/Federal Funds Rate spread narrowed to -84 bps on Thursday 21 September from -100 bps the previous Friday 15 September, 2023.
- The current 10y/FFR inversion which began on Tuesday 15 November 2022 is two hundred and twelve sessions old.
- The -171 bps spread on Thursday 04 May 2023 surpasses the -153 bps spread printed on Wednesday 05 and Thursday 06 April 2023 as the widest of the current inversion in over 22 years.
- The current inversion has surpassed the previous two inversions;
- May 2019 to March 2020
- July 2006 to January 2008
- One needs to go back to 02 January 2001 for a deeper inversion when the 10-year/FFR was at -175 bps.
- By my estimation, the inverted 10y/FFR spread would have widened to -89 bps on Friday 22 September 2023 from -84 bps on Thursday 21 September.
Since 1970, whenever the 10-year maturity yield fell below (inverted) against the Federal Funds Rate, a recession followed about a year later accompanied by a downturn in the financial markets. Over recent years, the holding period to qualify this inversion has varied widely, ranging between a couple of weeks to three quarters.
DXY Books 10th Week of Gains
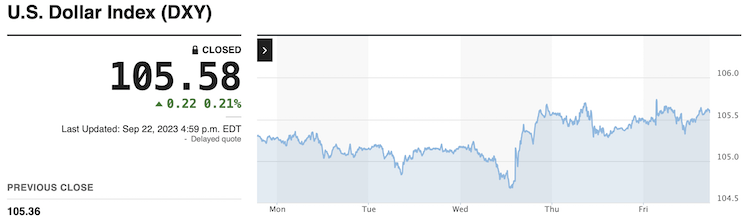
The US Dollar Index pared some gains to 105.6 on Friday, after PMI data for September showed a broad stagnation in total activity for the second month running. Service sector growth eased to an eight-month low and manufacturing output continued to contract due to high interest rates and persistent inflationary pressure. However, the dollar index is still on track for its tenth consecutive week of strengthening, after the Federal Reserve signaled a rate hike may be still on the table. The Fed kept the target range for the fund’s rate at 5.25%-5.5% but projections released in the dot-plot showed the likelihood of one more increase this year, then only two cuts in 2024. The Yen weakened to below 148 per dollar, the lowest since early November, after the BoJ maintained its key short-term interest rate at -0.1% on Friday. Also, the pound fell to $1.227, the lowest level since March, after the BoE decided to keep rates unchanged, defying expectations of a rate hike.
- EUR/USD: Lower by -0.1% to 1.0644 from 1.0657 the previous week, +9.8% YoY
- GBP/USD: Lower by -1.2% to 1.2239 from 1.2383 the previous week, +12.7% YoY
- USD/JPY: Higher by +0.4% to 148.36 from 147.83 the previous week, +3.5% YoY
- USD/CNY: Lower by -1.7% to 7.2957 from 7.3640 the previous week, +2.3% YoY
- USD/SGD: Higher by +0.0% to 1.3637 from 1.3625 the previous week, -4.7% YoY
Japanese Yen Weakens as BOJ Stands Pat
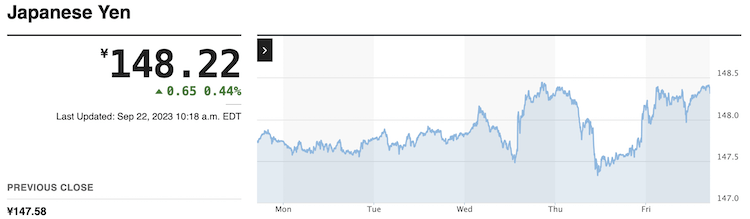
The Japanese Yen weakened past 148 per dollar, sliding back to near one-year lows after the Bank of Japan maintained its ultra-easy monetary policy as the board aims to achieve a price stability target of 2% in a sustainable manner, accompanied by wage increases. This dashed hopes that the central bank would hint at an end to its negative interest rates policy. Meanwhile, Japan’s Finance Minister Shunichi Suzuki said he would not rule out any options on currencies, warning against sharp yen depreciations that could hurt the economy. On the data front, Japan’s headline inflation rate slowed to 3.2% in August from 3.3% in July, while the core inflation rate stayed above the BOJ’s 2% target for the seventeenth straight month. Data also showed that business activity in the country slowed to a seven-month low in September.
Euro Depreciates to Over 6-Month Low on Weak PMI
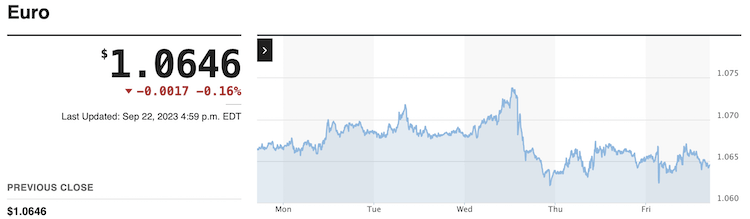
The Euro extended losses towards the $1.06 level, reaching its lowest point since mid-March, following the release of disappointing PMI data and indications that the European Central Bank may halt its interest rate hikes. The most recent PMI survey revealed a significant contraction in Eurozone business activity for September, with total new orders dropping the most in nearly three years. Meanwhile, a group of European Central Bank policymakers has expressed concerns about the possibility of another rate hike. ECB policy dove Philip Lane commented on Friday, stating that companies were now absorbing wage pressures, and the labor market was beginning to soften, suggesting that inflationary pressures resulting from wage increases may finally be subsiding.

Commodity prices fell in Week 38, weighed down by Crude Oil, Gold, Copper, Wheat and Soy.
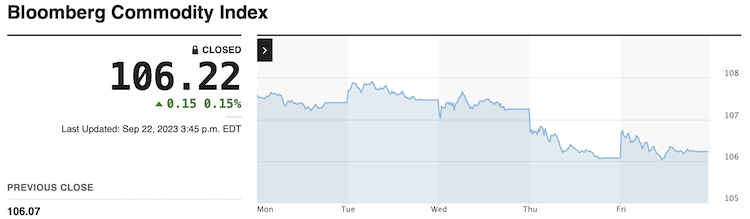
The broad-based Bloomberg Commodity Index closed lower at 106.22, down -1.2% from 107.47 in Week 37, 2023. Year-to-date, the index is down -5.8%.
Wednesday 31 May 2023’s close at 97.96 is the lowest close since Thursday 25 May 2023’s close at 99.29, setting a new 52 week low close. It is also the lowest close since 31 December 2021 at 99.17.
Wednesday 31 May 2023 saw the index print a 52-week intraday low at 97.69 at 10.00am ET, surpassing the previous 52-week intraday low on Thursday 25 May at 98.79.
The index touched an intraday high of 138.16 on Wednesday 08 June 2022 and printed its highest close this year on Thursday 09 June 2022 at 136.61, +1.20% higher than its previous high close on 18 April 2022 at 134.99.
Oil Edges Higher on Supply Concerns
WTI crude futures rose above $91 per barrel on Friday but settled lower, hovering close to ten-month highs amid concerns that a Russian ban on fuel exports could tighten global oil supply further. The Russian government announced Thursday it will temporarily restrict exports of gasoline and diesel to stabilize fuel prices in the domestic market. The ban comes after exports of diesel from the country have fallen by nearly a third in the first two weeks of September. Official data also showed that US crude inventories fell by 2.135 million barrels last week, and stocks at Cushing were at their lowest since July 2022. For the week, the US oil benchmark is up nearly 1%.
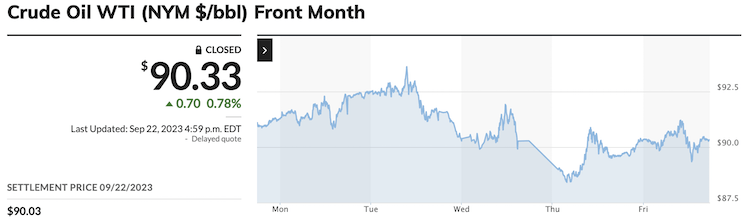
WTI crude futures settled at $90.03 per barrel on Friday while Brent futures settled at $91.96 per barrel.
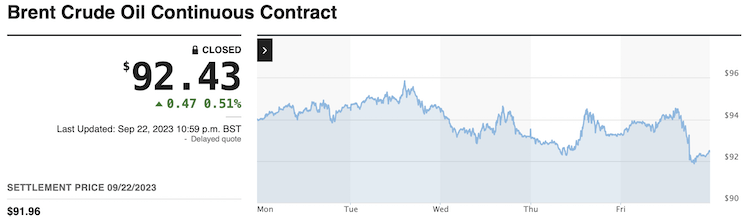
The settlement price spread between WTI and Brent decreased by -$1.25 to $1.93 from $3.16 the previous week on Friday 15 September 2023.
Baker Hughes total total U.S. rig count -11 at 630 (Prior: +9).
- WTI settled lower at $90.33/barrel from $90.77 the previous week (+12.2% YTD)
- Brent settled lower at $91.96/barrel from $93.93 the previous week (+7.5% YTD)
- Nat Gas settled higher at $2.88/MMBtu from $2.64 the previous week (-29.2% YTD)
![]()
Gold Settles Above $1,940, Lower For The Week
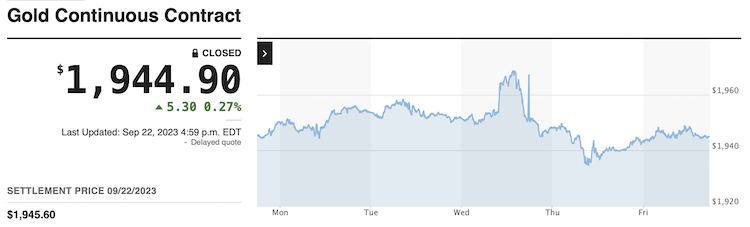
Gold settled lower for the week at $1,945.60 an ounce, as investors fretted about a hawkish Fed, global growth prospects and weak data from Europe. Also, the strengthened dollar dented the metal’s appeal. In its latest meeting, the US central bank left interest rates unchanged as widely anticipated, but signaled another rate increase before the end of the year and fewer rate cuts in 2024. Meanwhile, in Europe the tightening cycle has likely come to an end, with the Bank of England unexpectedly opting for a halt in interest rates. Additionally, the PMIs showed the continued contraction in Eurozone’s business activity. Elsewhere, the Bank of Japan maintained its ultra-easy monetary stance, as the board aims to achieve a price stability target of 2% in a sustainable manner, accompanied by wage increases.
Copper Sinks to Over 3-Month Low
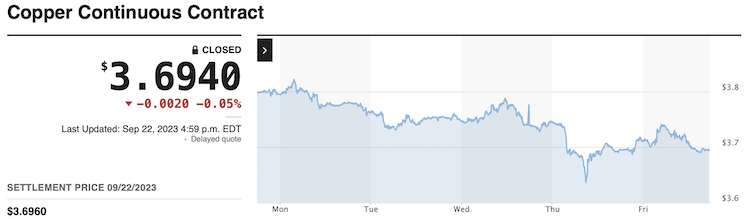
Copper futures fell below $3.7 per pound in September, approaching the August 18th low of $3.67 per pound, amid renewed pressure from a strong dollar and weak industrial sentiment worldwide. Despite momentary rebounds in industrial growth and new loans in top consumer China, persistent concerns over the financial health of property developers maintained worries that the country’s precarious macroeconomic backdrop has yet to bottom. Meanwhile, the outlook of a hawkish Federal Reserve and mounting growth concerns in Europe continued to pressure industrial activity, as evidenced by months of contractionary manufacturing PMIs. Still, futures refrained from decreasing even further as market players flagged large incoming copper deficits, with current production levels failing to keep up with increasing demand for electrification. Output from Chilean state-owned Codelco sank by 14% in the first half of the year, stretching the 7% decline from 2022.
- Gold settled lower at $1,945.60/oz, from $1,946.20/oz the previous week (+6.3% YTD)
- Silver settled higher at $23.84/oz, from $23.39/oz the previous week (-1.5% YTD)
- Copper settled lower at $3.70/oz, from $3.80/lb the previous week (-3.3% YTD)
![]()
Wheat Falls to 3-Year Low
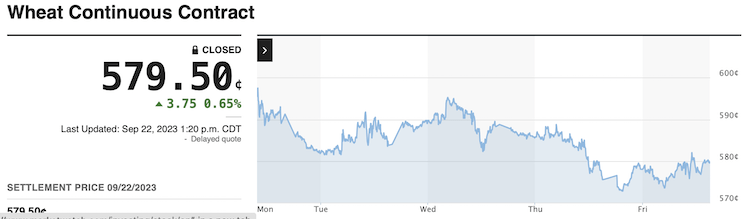
Wheat futures in the US fell below $5.8 per bushel in September, the lowest in nearly three years, amid increasing supply from the world’s top producers. Favorable weather in Russia boosted yields late in its harvest at the end of August. Hence, the latest WASDE report expects the country to produce 85 million tonnes of wheat this marketing year, lifting exports to be revised higher to a record-high of 49 million tonnes, by far the largest in the world. The large supplies already stimulated shipments out of the country, with SovEcon reporting a 17% rise in exports so far in September. Adding to the bearish pressure, the WASDE report also showed that global consumption forecasts were revised lower by 210,000 tonnes to 795.9 million amid lower demand in Southeast Asia, Northern Africa, and Canada. In the meantime, news of ships successfully arriving in Ukraine through a temporary corridor ramped up hopes that the country may be able to sell some of its grains in the foreign market.
- Corn settled higher at $4.77/bushel, from $4.76 the previous week (-29.6% YTD)
- Wheat settled lower at $5.79/bushel, from $6.04 the previous week (-26.7% YTD)
- Soyabeans settled lower at $12.96/bushel, from $13.38 the previous week (-15.0% YTD)
![]()
Crude Palm Oil Futures Hover at Near 3-Month Low
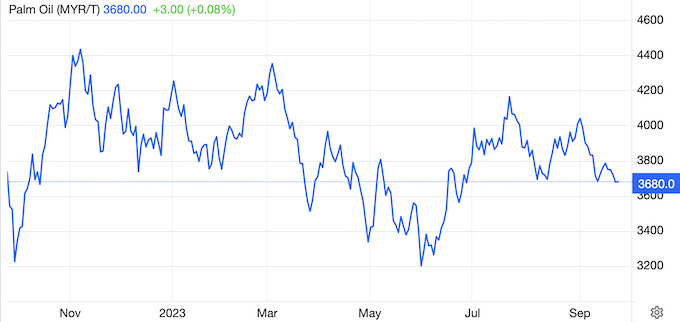
Malaysian palm oil futures were below MYR 3,700 per ton, approaching their lowest level in three months while pointing to the third straight weekly losses, amid persistent weakness in rival oils which offset support from higher exports. Shipments of palm oil products from Malaysia for September 1-20 rose 2.4% from a month earlier, cargo surveyor Intertek Testing Services said. Another cargo surveyor, Amspec Agri, mentioned that exports grew by 1.8% during the same period. Meantime, inventory data showed that Malaysian palm oil jumped 22.5% mom at the end of August to a 7-month high of 2.12 million tons. Separately, Kuala Lumpur kept its October export tax for palm oil at 8% and slashed its reference price. In top producer Indonesia, the attorney general’s office has launched a corruption investigation into the country’s palm oil fund agency, which oversees the collection and distribution of export levies on the commodity.
![]()
Baltic Exchange Dry Index Up on Friday, Posts Weekly Gain
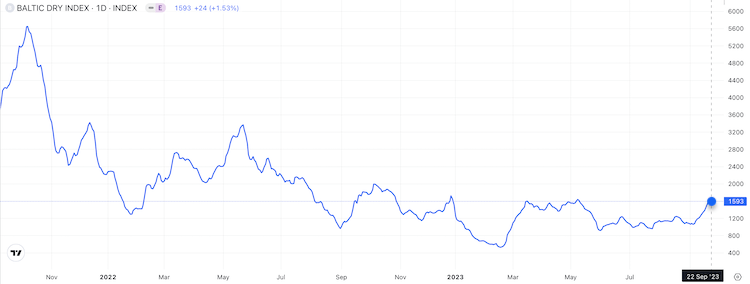
The Baltic Exchange’s dry bulk sea freight index, which measures the cost of shipping goods worldwide, rose about 1.5% to its highest level since May 11 at 1,593 points on Friday, mainly supported by the bigger size segment. The capesize index, which tracks vessels typically transporting 150,000-tonne cargoes such as iron ore and coal, advanced 3.8% to an over four-month high of 2,083 points; and the supramax index added 5 points to 1,355 points. Meanwhile, the panamax index, which tracks ships that usually carry coal or grain cargoes of about 60,000 to 70,000 tonnes, shed 11 points to 1,685 points. The benchmark index increased by 15.4% for the week, recording its third consecutive weekly gain.

• • • • •

Asian Stocks
Asian equity markets ended the week mixed as the Bank of Japan left its monetary policy unchanged after its latest meeting concluded on Friday, with some markets paring losses earlier in the day.
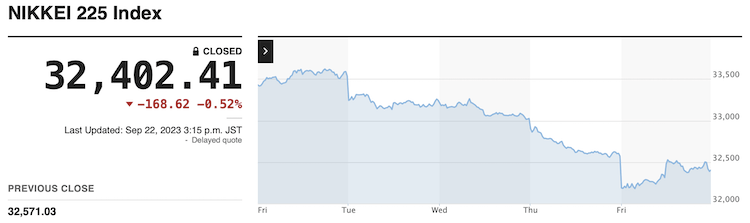
The Nikkei 225 Index fell 0.52% to close at 32,402 while the broader Topix Index lost 0.3% to 2,376 on Friday, extending recent losses after the Bank of Japan maintained its ultra-easy monetary policy, dashing hopes that the central bank would hint at an end to its negative interest rates policy. Japanese shares also tracked losses on Wall Street overnight as the US Federal Reserve’s hawkish pause continued to weigh on investor sentiment. Meanwhile, investors digested data showing Japan’s headline inflation rate slowed to 3.2% in August from 3.3% in July, while the core inflation rate stayed above the BOJ’s 2% target for the seventeenth straight month. Data also showed that business activity in the country slowed to a seven-month low in September. The Nikkei 225 declined 3.4% this week for its worst weekly performance since December last year, while the Topix fell 2.15%.
The Hang Seng surged 402.04 points or 2.28% to end at 18,057.46 on Friday, closing in the green for the first session in three while escaping from its lowest level in a month notched the day before, with all major sectors contributing to the upturn. Investors were eager to add new positions after Bloomberg News reported that China was exploring policy tweaks to boost foreign ownership in stocks listed in the country as part of efforts to open up the market and boost trading. Locally, the current account surplus in Hong Kong notably widened in Q2 of 2023 while the headline inflation in August stayed at its lowest in four months.
The Shanghai Composite jumped 1.55% to close at 3,132 while the Shenzhen Component rallied 1.97% to 10,179 on Friday, with both benchmarks finishing the week slightly higher amid growing optimism that a series of stimulus measures from Beijing would speed up China’s economic recovery in the fourth quarter. Analysts also cited better-than-expected Chinese economic data in August that provided tentative signs that growth and inflation have bottomed out. Still, investors remain cautious as the US Federal Reserve’s hawkish pause pushed Treasury yields higher and pressured equities globally. Technology and consumer-related stocks led the advance.
The S&P/ASX 200 Index reversed losses from earlier in the session to end 0.05% higher at 7,069 on Friday, but still finished the week nearly 3% lower as the US Federal Reserve’s hawkish pause continued to weigh on investor sentiment. Domestically, investors digested data showing Australia’s manufacturing activity contracted further in September, while services activity turned expansionary.
Singapore stocks rise amid mixed regional performance; STI up 0.1%
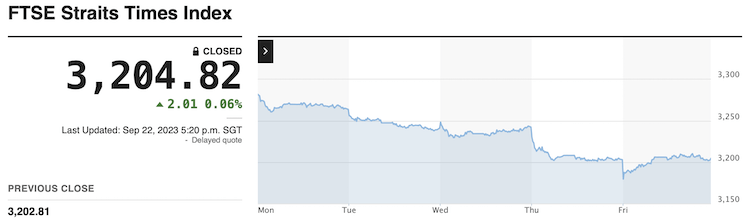
The Straits Times Index (STI) ended Friday (Sep 22) slightly higher after paring early losses. The STI rose 0.1 per cent or 2.01 points to 3,204.82 at the close. But the blue-chip gauge was 2.3 per cent lower week on week, after declining three days this week. Across the broader market, gainers beat decliners 302 to 241, with some 1.3 billion securities worth S$801 million changing hands.
Bursa snaps four-day losing streak, ends firmer
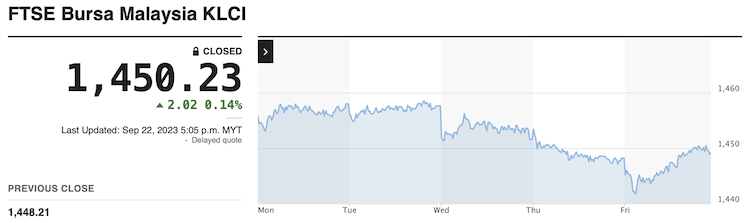
Bursa Malaysia ended the week higher due to a positive regional performance, according to an analyst, breaking a four-day losing streak. The FTSE Bursa Malaysia KLCI (FBM KLCI) bagged had risen 2.02 points to 1,450.23, from Thursday’s close at 1,448.21.
The index opened 2.33 points weaker at 1,445.88, and moved between 1,441.50 and 1,450.69 throughout the day. The broader market was positive, with advancers leading decliners 504 to 403, while 472 counters were unchanged, 1,012 untraded, and 49 others suspended. Main Market volume fell to 2.08 billion units worth RM1.82 billion, from 2.14 billion units worth RM1.90 billion on Thursday.
![]()
- Japan’s Nikkei: -0.5% (-3.4% for the week) 24.2% YTD
- Hong Kong’s Hang Seng: +2.3% (-0.7% for the week) -8.7% YTD
- China’s Shanghai Composite: +1.6% (+0.5% for the week) +1.4% YTD
- India’s Sensex: -0.3% (-2.7% for the week) +8.5% YTD
- South Korea’s Kospi: -0.3% (-3.6% for the week) +12.2% YTD
- Australia’s ASX All Ordinaries: +0.1% (-2.8% for the week) +0.7% YTD
- Malaysia’s FKLCI: +0.1% (-0.6% for the week) -3.0% YTD
- Singapore’s STI: +0.1% (-2.3% for the week) -1.4% YTD

European Stocks Suffer Worst Week in 5
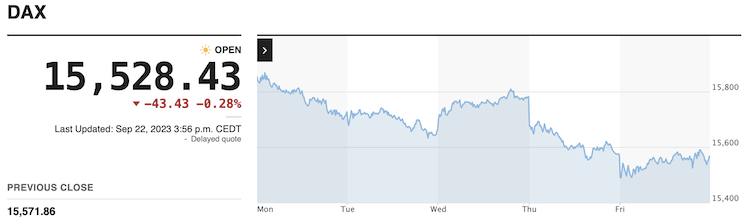
The German DAX lost more than 2% this week, the most since mid-August on worries over higher-for-longer rates.

The benchmark Stoxx 600 fell 1.6% during the week and was 0.3% down on Friday, dragged by construction and material stocks while tech shares rose. A series of PMI surveys showed that Eurozone business activity continued to contract at a significant pace in September, with new orders declining the most in nearly three years. Among single stocks, Dutch banks ING Groep NV and ABN AMRO Bank NV dropped 6.4% and 4.5%, respectively, after a majority of the Dutch parliament’s second chamber approved a proposal to increase bank taxes.
UK Stocks Close Week Lower
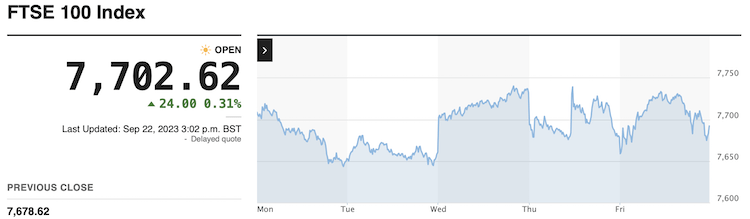
Equities in London closed a choppy session below the flatline at 7,670 on Friday, dropping 0.5% on the week as markets assessed the latest economic data and their potential impact on the BoE’s future decisions. Yesterday, the BoE held its Bank Rate unchanged for the first time in nearly two years, opting to favor mounting growth concerns. Fresh data showed that the UK’s private-sector activity contracted more than expected as higher borrowing costs are having a growing impact on service providers. Additionally, retail sales growth missed expectations in August, adding to bets that the BoE may prefer to refrain from raising rates again to attend a slowing economy. Phoenix shares fell 1.6% as investors reacted to the company’s purchase of a stake in Hambro Perks. Additionally, Halma sank 3.5%, remaining under pressure from underwhelming results posted in the previous session. Banks advanced on the other hand, with Lloyds jumping 2% and HSBC adding 1%.
![]()
- U.K.’s FTSE 100: +0.1% (-0.4% week-to-date) +3.1% YTD
- Germany’s DAX: -0.1% (-2.1% week-to-date) +11.7% YTD
- France’s CAC 40: -0.4% (-2.6% week-to-date) +11.0% YTD
- Italy’s FTSE MIB: -0.5% (+1.3% week-to-date) +20.5% YTD
- Spain’s IBEX 35: -0.5% (-0.5% week-to-date) +15.5% YTD
- STOXX Europe 600: -0.3% (-1.9% week-to-date) +6.7% YTD
• • • • •

Friday 22 September 2023, AMC
From last weekend’s WMO;
“(Week 37’s) consolidation-downside prediction on weekly candles worked like a charm! The benchmark indices stay below their respective 50DSMAs while RUT barely manages to stay above its 200DSMA after having closed below that key indicator on Wednesday.“
Click to expand
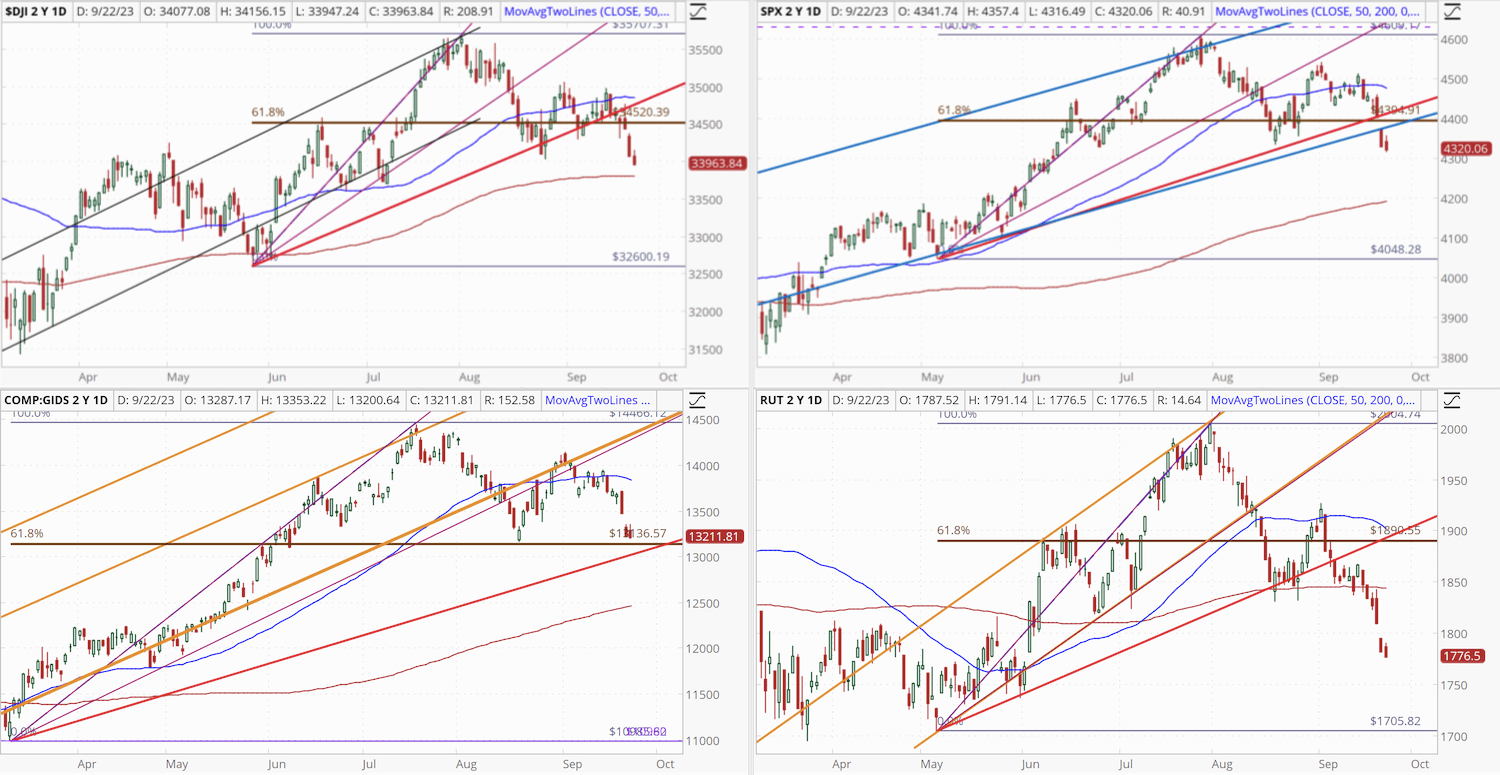
DJIA and SPX joined RUT in breaking out below their respective PhiB-Fans and COP (61.8%) levels while COMP is barely holding above its COP (61.8%) level. RUT continues to breakdown and confirmed its downtrend with lower lows this week. The mid-cap index is now also well below its 200DSMA as of Friday’s close.
“… the SPX and COMP completed Weeks 35, 36 and 37 to form a Three Inside Down pattern (weekly candles), implying more downside in the coming week. DJIA followed up its Bearish Harami with a Bearish Inverted Crucifix Doji that reliably indicates downside and a break-below-and-out of its PhiB-Fan and current PhiB COP (61.8%) level.“
Once again, weekly candlestick analysis worked like a charm to predict the downturn in Week 38. The COMP in weekly candles is also showing that the tech-heavy index is about to form a Death Cross (200 over 50) on weekly candles.
Sector & Industry ETFs Summary
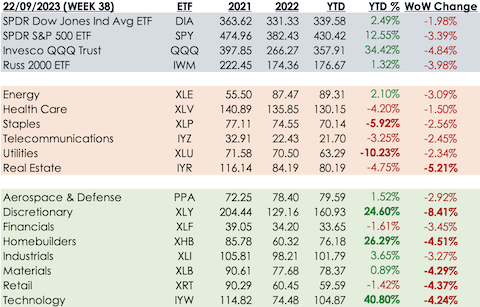
Week 38 finished to the downside on the benchmark indices with no sector spared for a second straight week.
- There were no weekly gainers this week.
- Energy remains the only defensive sector that’s positive YTD.
- Financials and Retail are the only growth sectors in the red YTD.
- Discretionary is the worst loser this week, followed by Real Estate.
- Utilities remains the worst loser YTD for an eighth week with Staples, Real Estate and Health Care in tow.
- Technology, Discretionary and Homebuilders remain the best gainers YTD for a twenty-sixth straight week.
- Technology is still by far the stand-out winner YTD.
Shiller PE Ratio
The Shiller PE Ratio, as of Friday 22 September, is at 29.70, -2.91% lower than 30.59 the previous week, below double of its mean (17.05) and its median (15.94). At this level, the ratio is just below the middle between the historical high (44.19) and the mean or the median.
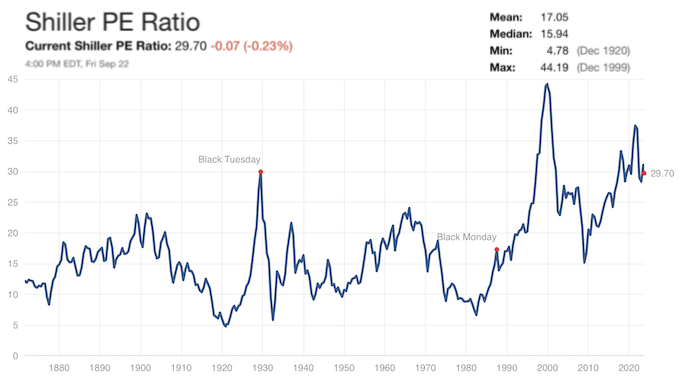
The U.S. market printed its second highest Shiller PE Ratio in its history at 40.00 in October 2021. The largest bubble remains as December 1999 at 44.19.

22 September 2023 AMC
Last weekend;
“The numbers are still mostly with the bears although it must be said that the bulls are getting a slight peek into the game as of the past week’s $UVOL on NASDAQ.”
Click to expand
The bears have the ball and they’re running with it. No surprises there as this is usually the time of the year that usually see this.
![]()
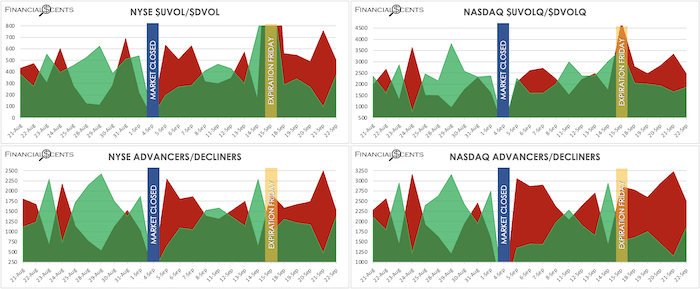
“Just when the bulls make an attempt, the bears over-run them again. The coming week is going to be a blood bath if the bulls don’t pick up their game in the year’s most bearish week.“
The reds have over-run the greens. The question now is how much longer they can sustain this momentum before the optimistic dip-buying crowd returns on the slightest good news.
![]()
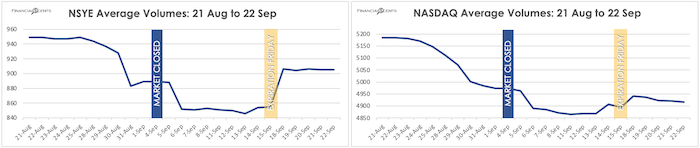
Last weekend;
“Volumes seem to have found a bottom, Expiration Friday notwithstanding, and it couldn’t have come at a worst time for the bulls … the next two weeks are the years most bearish on record.“
Volumes are still woeful but at least they’re off their lows, more so on NYSE than on NASDAQ. The coming week might see a resumption of declining average volumes again as I expect this sell off to persist.
![]()
The CBOE Volatility Index (VIX), often referred to as Wall Street’s “fear gauge,” closed Week 38 at 17.20, +24.7% higher than the previous week’s close at 13.79.
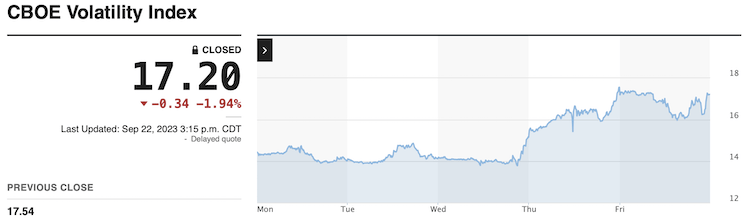
- The VIX printed its 52-week intraday high on 28 September 2022 at 34.88.
- The highest close in the past 12 months is 11 October 2022 at 33.63.
- The lowest close in the past one year is currently 12.91, printed on 22 June 2023.
- The 52 week (intraday) low is 12.73 also from 22 June 2023.
Put/Call Ratios
Any reading above 1.00 is regarded as bearish. As a common practice amongst the professionals, it is worth noting that the big money indicators are reliably the Index and ETF Put/Call Ratios while the Equity Put/Call Ratios are mostly novice/amateur participation;
- Total Put/Call Ratio closed higher at 1.16 from 0.94 the previous week.
- Index Put/Call Ratios jumped to 1.28 from 1.04 the previous week.
- ETF Put/Call Ratios spiked to 1.30 from 1.08 from a week ago.
- Equity Put/Call Ratios climbed to 0.85 from 0.70 the previous week.
- The CBOE VIX Put/Call Ratio rose to 0.51 from 0.43 last week.
(Note: The VIX generally measures the options activity of the 500 S&P500 issues).

• • • • •

After a week filled with central bank meetings, attention will once again shift to macroeconomic data. In the United States, the spotlight will be on the PCE Price Index, as well as personal income and spending data. Additionally, the focus will be directed toward durable goods orders, the final reading of the Q2 GDP growth rate, and pending and new home sales. In Europe, September inflation rates will be released for the Euro Area, Germany, France, Italy, and Spain. Finally, investors are set to monitor Ifo Business Climate, GFK Consumer Confidence, and retail sales figures for Germany, along with industrial production, retail sales, the unemployment rate, consumer confidence, and the BoJ Monetary Policy Meeting Minutes in Japan.
Benchmark Indices ($DJIA, SPX AND COMP 21-year average)
- Week 39 (25 to 29 September) is mostly flat with mild swings.
- The final week of September is prone to swings and ends poorly.
- The final week of September is also the end of Q3 and is prone to Portfolio Restructuring by institutions.
- The last trading day in September has been down on SPX 16 of the last 25 but up 5 of the last 7 (last year down).
Benchmark Index ETFs (DIA, SPY 19-Year Average & QQQ 13-Year Average):
- Week 39 (25 to 29 September) tends to be flat with slightly volatile swings.
Week 39 Key U.S. Economic Notes:
- Monday 25 September – Nothing of note
- Tuesday 26 September – FHFA Housing Price Index, S&P Case-Shiller Home Price Index, Consumer Confidence, New Home Sales,
- Wednesday 27 September – MBA Mortgage Applications Index, Durable Goods, Durable Goods –ex transportation, EIA Crude Oil Inventories
- Thursday 28 September – Initial Claims, Continuing Claims, GDP – Third Estimate, GDP Deflator – Third Estimate, Pending Home Sales, Natural Gas Inventories
- Friday 29 September – Adv. Intl. Trade in Goods, Chicago PMI, PCE Prices, PCE Prices – Core, Personal Income, Personal Spending, UoM Consumer Sentiment – Final

U.S. Economic Releases for Week 39
All eyes will be focused on the US personal outlays and income report, with particular anticipation surrounding the release of the PCE price index. It is expected that core PCE prices have risen by 0.2% in August, the same pace as in July; while the annual rate, which is considered the Federal Reserve’s preferred gauge of inflation, is expected to have eased to 3.8%, marking its lowest point since June 2021. The report is also poised to reveal a 0.5% increase in consumer spending and a 0.4% gain in income for the same period. In addition, investors will closely monitor August’s durable goods orders, as well as the final readings on second-quarter GDP growth and September’s Michigan consumer sentiment. Moreover, the housing market will come under scrutiny, with a focus on Case-Shiller home prices, new and pending home sales figures. Additionally, market watchers will keep a close eye on advance estimates of wholesale inventories, the goods trade balance, CB consumer confidence, the Chicago Fed National Activity Index, and the Dallas Fed Manufacturing Index.
Monday 25 September
- Nothing of note
Tuesday 26 September
- July FHFA Housing Price Index (prior 0.3%) at 9:00 ET
- July S&P Case-Shiller Home Price Index (prior -1.2%) at 9:00 ET
- August New Home Sales (prior 714,000) at 10:00 ET
- September Consumer Confidence (prior 106.1) at 10:00 ET
- $48 bln 2-yr Treasury note auction results at 13:00 ET
Wednesday 27 September
- MBA Mortgage Applications (prior 5.4%) at 7:00 ET
- August Durable Orders (prior -5.2%) at 8:30 ET
- Durable Orders ex-transportation (prior 0.5%) at 8:30 ET
- Weekly crude oil inventories (prior -2.14 mln) at 10:30 ET
- $49 bln 5-yr Treasury note auction results at 13:00 ET
Thursday 28 September
- Q2 GDP – third estimate (prior 2.1%) at 8:30 ET
- Q2 GDP Deflator – third estimate (prior 2.0%) at 8:30 ET
- Weekly Initial Claims (prior 201,000) at 8:30 ET
- Continuing Claims (prior 1.662 mln) at 8:30 ET
- August Pending Home Sales (prior 0.9%) at 10:00 ET
- Weekly natural gas inventories (prior +64 bcf) at 10:30 ET
- $37 bln 7-yr Treasury note auction results at 13:00 ET
Friday 29 September
- August Personal Income (prior 0.2%) at 8:30 ET
- Personal Spending (prior 0.8%) at 8:30 ET
- PCE Prices (prior 0.2%) at 8:30 ET
- Core PCE Prices (prior 0.2%) at 8:30 ET
- Advance goods trade balance (prior -$91.2 bln) at 8:30 ET
- Advance Retail Inventories (prior 0.3%) at 8:30 ET
- Advance Wholesale Inventories (prior -0.1%) at 8:30 ET
- September Chicago PMI (prior 48.7) at 9:45 ET
- Final September University of Michigan Consumer Sentiment (prior 67.7) at 10:00 ET

International Economic Releases for Week 39
The United Kingdom will publish the final estimate of second-quarter GDP growth, alongside current account, Bank of England’s monetary indicators, CBI distributive trades, and Nationwide house price index.
In Europe, all eyes will turn to the flash CPI report from the Eurozone, Germany, France, Italy, and Spain. The annual inflation rate in the Euro Area is expected to slow for the fifth consecutive month to 4.5% in September, the lowest since October 2021 but still well above the ECB’s 2% target. In Germany, a sharp drop in headline inflation to 4.6% is expected mainly due to lower external costs. On the other hand, in France, inflation is expected to accelerate slightly to 5%. Additionally, for Germany, the Ifo Business Climate indicator is expected to decline for the fifth consecutive month to its lowest level since October 2022, while the GfK Consumer Climate Indicator is likely unchanged from September’s four-month low. On a brighter note, German retail sales probably rebounded marginally after two consecutive months of falls. Other data to follow includes the Euro Area’s business survey, Germany’s unemployment rate, Italy’s consumer and business survey, France’s jobless data and consumer morale, Switzerland’s KOF Leading indicators, and Turkey’s business confidence.
In Asia, a week will be headlined by minutes from the Bank of Japan’s latest policy meeting, offering insights on the timeline for the central bank’s potential pivot away from ultra-loose monetary policy, in addition to potential support for the yen. Other data from Japan includes industrial production, retail sales, and the unemployment rate for August.
In India, alI eyes will be on the current account for the second quarter. Also, South Korea will divulge business and consumer confidence for September. Elsewhere, the Bank of Thailand will hold another monetary policy decision, while Singapore’s inflation rate is expected to ease.
In Australia, the monthly inflation rate is expected to rebound for the first time since April, pressuring recent holds from the RBA. Retail sales and batch of Aussie credit data are also eyed, while New Zealand will release forward-looking confidence indicators.
Monday 25 September
- UK – CBI Realized Sales
- EU –
- German Import Prices m/m, Retail Sales m/m, Ifo Business Climate
- Belgian NBB Business Climate
Tuesday 26 September
- Japan – SPPI y/y, BOJ Core CPI y/y
- China – CB Leading Index m/m
Wednesday 27 September
- Japan – Monetary Policy Meeting Minutes
- Australia – CPI y/y
- EU –
- German GfK Consumer Climate
- Eurozone M3 Money Supply y/y, Private Loans y/y
Thursday 28 September
- Australia – Retail Sales m/m
- UK – Nationwide HPI m/m
- EU –
- ECB Economic Bulletin
- German Prelim CPI m/m
- Spanish Flash CPI y/y
Friday 29 September
- Australia – Private Sector Credit m/m
- Japan – Tokyo Core CPI y/y, Unemployment Rate, Prelim Industrial Production m/m, Retail Sales y/y, Consumer Confidence, Housing Starts y/y
- UK – Current Account, Final GDP q/q, Revised Business Investment q/q, M4 Money Supply m/m, Mortgage Approvals, Net Lending to Individuals m/m
- EU –
- ECB President Lagarde Speaks
- Eurozone CPI Flash Estimate y/y, Core CPI Flash Estimate y/y
- German Unemployment Change
- French Consumer Spending m/m, Prelim CPI m/m
- Italian Prelim CPI m/m
Saturday 30 September
- China – Manufacturing PMI, Non-Manufacturing PMI
- UK – MPC Member Cunliffe Speaks
Sunday 01 October
- China – Caixin Manufacturing PMI, Caixin Services PMI

Monday 25 September 2023
- The final week of September is prone to swings and ends poorly.
- The final week of September is also the end of Q3 and is prone to Portfolio Restructuring by institutions.
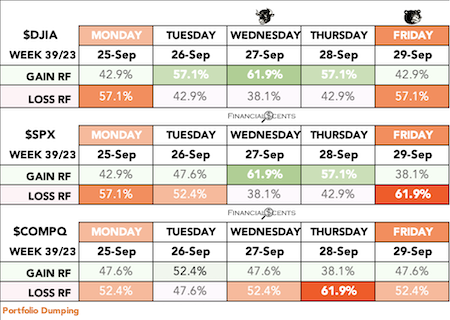
The Stock Trader’s Almanac’s stats for the Benchmark Indices for Monday of Week 39 over a 21-year average are;
- Dow Jones (DJIA): Bearish 57.1%
- S&P 500 (SPX): Bearish 57.1%
- NASDAQ (COMP): Mildly Bearish 52.4%
![]()
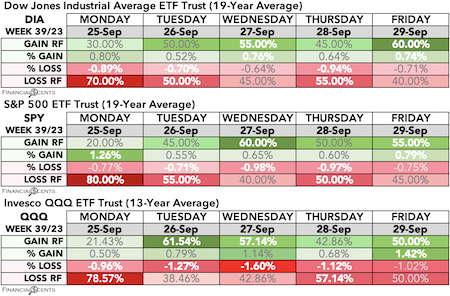
The Pattern Trader™ Tools Screener stats for the Benchmark Index ETFs for Monday of Week 39;
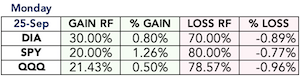
- SPDR DJIA ETF Trust (DIA – 19yr Avg): Very Bearish 70.00%
- SPDR S&P 500 ETF Trust (SPY – 19yr Avg): Ridiculously Bearish 80.00%
- Invesco QQQ Trust Series I (QQQ – 13yr Avg): Extremely Bearish 78.57%
Monday 25 September
- UK – CBI Realized Sales
- EU –
- German Import Prices m/m, Retail Sales m/m, Ifo Business Climate
- Belgian NBB Business Climate
- US – Nothing of note

Investors pulled $19 billion from stocks in the last week,
the highest outflow all year amid surging bond yields and Fed jitters
~ Market Insider ~
Investor outflows from stocks were the highest they’ve been all year in the last week, as markets mull the possibility that interest rates could remain elevated for longer than expected, according to Bank of America. Stocks saw $18.96 billion of outflows over the past week, Bank of America data shows, the largest weekly outflow recorded since December 2022. The outflows were capped by the Fed’s policy meeting this week, where chief central banker Jerome Powell warned that the Fed could take interest rates higher for longer than markets have been expecting.

The Market Is Not The Economy … and Vice-Versa
From last weekend’s WMO
“… with the FOMC Monetary Policy Decision due on Wednesday, I won’t be betting my house on it … maybe the kitchen sink but definitely not the house …“
This week, as expected, I got flooded with queries about the market and the possibility of a recession coming.
To that, I will only repeat myself once more – the market is not the economy and the economy is not the market. What that means is that the market can fall without the economy going into a recession or slowdown. Likewise, the economy can contract into a recession without a market correction. The two need not correlate and neither do they have to happen together. In many cases, the market leads the way down for the economy to contract. In other times the economy contracts and the market follows in fear even if fundamentals remain intact.
For now, the fundamentals in the market are holding up enough to avoid a major crash, although, having said that, we’re three weeks away from the start of the next earnings season. Barring any huge shocks and horrible guidance, there really is no reason (for now) to believe that the market is going to do a repeat of 2022. Yes, there are spots of concerns here and there in the global theatre but these have to be monitored closely before jumping to conclusions or speculating blindly on a vain prospect.
The market has been a normal one this year and this current correction is all part and parcel of what the market does on an annual cycle. So let’s not get ahead of ourselves just yet – a seasonal correction is exactly just that and should not be conceived as the start of another market downturn … at least not until we get further evidence to justify it.

Happy Hunting!
Copyright© 2023 FinancialScents Pte Ltd
~~~~~~~~~~~~~~~~~~~~~~~~~~~~~~~~~~~~

After 17 years of educating, mentoring and supporting hundreds of participants (annually) in the arts and sciences of Finance and Economics, the Pattern Trader™ Tutorial has evolved to become the most exclusive and sought-after boutique-styled class that caters to retail individuals, institutional professionals, businesses and families that are serious about their finances and their prospects as we move into the future.
Enriching, Fulfilling, Life Changing

The personal mentorship and tutorial-styled approach delivers a conducive environment that allows for close communication and interaction between the mentor and the participant. The hands-on style makes the Tutorial very practical for anyone who requires a start from the ground up. It is the perfect beginning for anyone who wishes to take that first step in improving their financial and economic literacy.
If you’re looking to make a huge difference in your financial life and get the most value for your education investment, there’s no better choice than the time-tested and well reputed Pattern Trader™ Tutorial
Download our promo slides here: The Pattern Trader™ Tutorial

~~~~~~~~~~~~~~~~~~~~~~~~~~~~~~~~
Write to support@patterntrader.com for queries and further information.